emooki
HomePrice mapTransactions
🇬🇧 English🇫🇷 Français🇩🇪 Deutsch🇪🇸 Español🇮🇹 Italiano

Real estate price map


Real estate price map in the Ardèche department.

Department 07
Ardèche

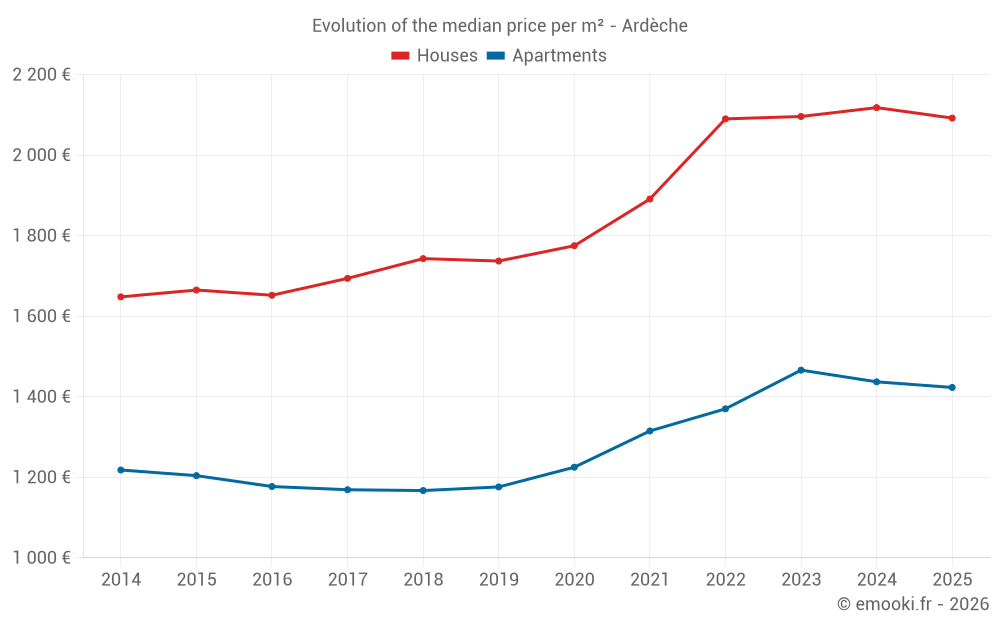
Median price of real estate
in the Ardèche department

HousesHouses
2 112  /m²
1-23-45-67-89-10
Reliability 10/10
Median price on the 432 transactions of the last 3 months.
from 1 273 to
2 859  /m²
60% of transactions from the 2nd to the 8th deciles.
ApartmentsApartments
1 412  /m²
1-23-45-67-89-10
Reliability 10/10
Median price on the 176 transactions of the last 3 months.
from 948 to
1 994  /m²
60% of transactions from the 2nd to the 8th deciles.
DwellingsDwellings
1 861  /m²
1-23-45-67-89-10
Reliability 10/10
Median price on the 608 transactions of the last 3 months.
from 1 120 to
2 702  /m²
60% of transactions from the 2nd to the 8th deciles.
HousesEvolution of the price per m² of houses since...
1 year
-1.2%
2 years
-0.2%
3 years
+0.1%
4 years
+11%
5 years
+18%
6 years
+20%
7 years
+20%
8 years
+23%
9 years
+27%
10 years
+26%
11 years
+27%
ApartmentsEvolution of the price per m² of apartments since...
1 year
-1%
2 years
-2.9%
3 years
+3.9%
4 years
+8.2%
5 years
+16%
6 years
+21%
7 years
+22%
8 years
+22%
9 years
+21%
10 years
+18%
11 years
+17%

Yearly evolution

Evolution of the median price per m²

Evolution of the number of transactions

Warning, last year incomplete. Projections made based on the proportions between semesters of the previous year at the departmental/national level and by type of property.

Yearly data

Descending order
Year
Houses
house
transactions
Houses
house
Price per m²
Apartments
apt.
transactions
Apartments
apt.
Price per m²
2025
1 093
2 092 
449
1 423 
2024
2 826
2 118 
1 063
1 437 
2023
3 030
2 096 
1 194
1 466 
2022
3 887
2 090 
1 415
1 370 
2021
4 221
1 891 
1 331
1 315 
2020
3 383
1 775 
1 121
1 225 
2019
3 209
1 737 
1 182
1 176 
2018
2 979
1 743 
1 005
1 167 
2017
2 897
1 694 
972
1 169 
2016
2 526
1 652 
901
1 177 
2015
2 298
1 665 
881
1 204 
2014
2 077
1 648 
707
1 218 

Analysis

Structure of prices per m²

Values of price percentiles per m² over the periods used for the estimated price of each type of property.

Structure of transaction amounts

Values of transaction amounts percentiles over the periods used for the estimated price of each type of property.

Transaction amounts and prices per m² by percentile

Ascending order
Percentile
Houses
house
Price per m²
Houses
house
Transaction amount
Apartments
apt.
Price per m²
Apartments
apt.
Transaction amount
10th percentile
868 
75 000 
757 
47 500 
20th percentile
1 273 
105 K
948 
60 000 
30th percentile
1 582 
130 K
1 088 
67 250 
40th percentile
1 828 
160 K
1 250 
82 180 
50th percentile
2 112 
180 K
1 412 
93 000 
60th percentile
2 368 
214 K
1 628 
106 K
70th percentile
2 562 
244 K
1 852 
130 K
80th percentile
2 859 
285 K
1 994 
153 K
90th percentile
3 256 
336 K
2 552 
230 K

Quarterly evolution

Evolution of the median price per m²

Evolution of the number of transactions

Quarterly data

Descending order
Quarter
Houses
house
transactions
Houses
house
Price per m²
Apartments
apt.
transactions
Apartments
apt.
Price per m²
2025 Q2
432
2 112 
176
1 412 
2025 Q1
661
2 086 
273
1 455 
2024 Q4
792
2 148 
302
1 532 
2024 Q3
783
2 091 
279
1 437 
2024 Q2
625
2 106 
257
1 403 
2024 Q1
626
2 104 
225
1 375 
2023 Q4
706
2 094 
290
1 424 
2023 Q3
821
2 105 
305
1 447 
2023 Q2
746
2 080 
320
1 484 
2023 Q1
757
2 092 
279
1 475 
2022 Q4
956
2 108 
364
1 423 
2022 Q3
1 014
2 158 
339
1 373 
2022 Q2
1 023
2 075 
371
1 353 
2022 Q1
894
2 016 
341
1 357 
2021 Q4
1 107
1 922 
333
1 300 
2021 Q3
1 150
1 962 
358
1 371 
2021 Q2
1 069
1 833 
363
1 333 
2021 Q1
895
1 800 
277
1 220 
2020 Q4
1 174
1 852 
362
1 318 
2020 Q3
851
1 770 
253
1 213 
2020 Q2
692
1 726 
242
1 244 
2020 Q1
666
1 756 
264
1 140 
2019 Q4
917
1 713 
327
1 273 
2019 Q3
846
1 750 
286
1 152 
2019 Q2
751
1 743 
285
1 186 
2019 Q1
695
1 741 
284
1 122 
2018 Q4
825
1 700 
273
1 138 
2018 Q3
758
1 816 
236
1 107 
2018 Q2
716
1 684 
273
1 174 
2018 Q1
680
1 718 
223
1 223 
2017 Q4
784
1 669 
230
1 176 
2017 Q3
814
1 706 
239
1 141 
2017 Q2
679
1 694 
266
1 219 
2017 Q1
620
1 694 
237
1 123 
2016 Q4
701
1 705 
225
1 257 
2016 Q3
671
1 695 
254
1 182 
2016 Q2
654
1 650 
237
1 146 
2016 Q1
500
1 511 
185
1 095 
2015 Q4
673
1 691 
253
1 167 
2015 Q3
685
1 667 
225
1 207 
2015 Q2
531
1 600 
218
1 248 
2015 Q1
409
1 659 
185
1 238 
2014 Q4
514
1 632 
153
1 284 
2014 Q3
572
1 682 
184
1 236 
2014 Q2
528
1 650 
199
1 139 
2014 Q1
463
1 618 
171
1 274 

Ardèche (07)

Most expensive cities

City
name
Descending orderHouses
house
Price per m²
3 539 
3 238 
3 111 
3 110 
3 088 
3 071 
2 873 
2 862 
City
name
Descending orderApartments
apt.
Price per m²
15 789 
3 723 
3 396 
3 393 
3 104 
2 882 
2 835 
2 698 
2 676 

Least expensive cities

City
name
Ascending orderHouses
house
Price per m²
469 
580 
720 
860 
963 
1 000 
City
name
Ascending orderApartments
apt.
Price per m²
205 
263 
269 
331 
349 
355