emooki
HomePrice mapTransactions
🇬🇧 English🇫🇷 Français🇩🇪 Deutsch🇪🇸 Español🇮🇹 Italiano

Real estate price map


Real estate price map in the municipality of Labastide-sur-Bésorgues.

Ardèche (07)
Labastide-sur-Bésorgues

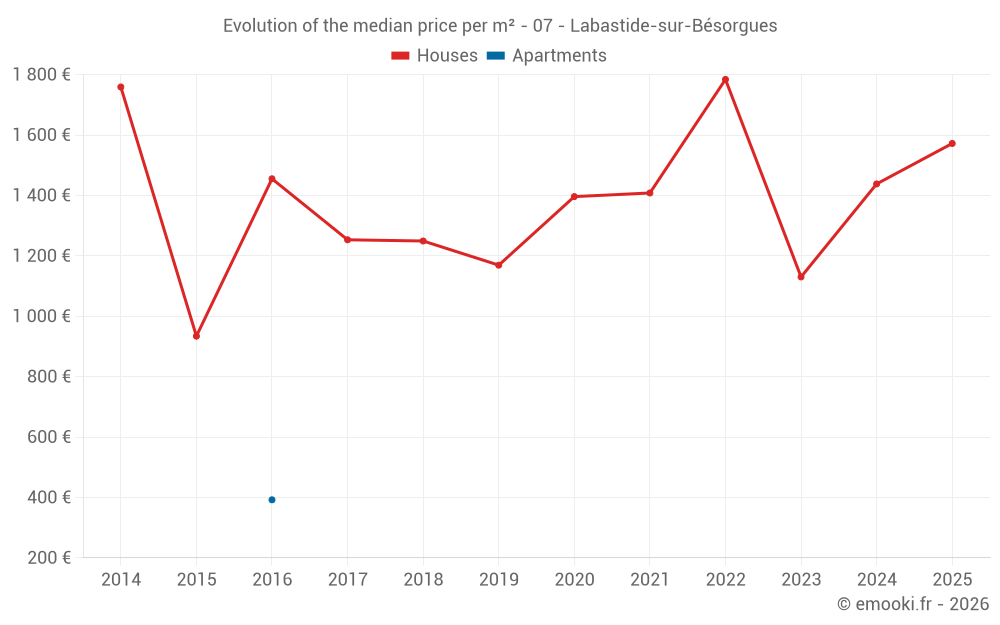
Median price of real estate
in the municipality of Labastide-sur-Bésorgues

HousesHouses
1 528  /m²
1-23-45-67-89-10
Reliability 6/10
Median price on the 18 transactions of the last 36 months.
from 1 112 to
2 318  /m²
60% of transactions from the 2nd to the 8th deciles.
ApartmentsApartments
392  /m²
1-23-45-67-89-10
Reliability 1/10
Price of the unique transaction of the last 120 months.
DwellingsDwellings
1 528  /m²
1-23-45-67-89-10
Reliability 6/10
Median price on the 18 transactions of the last 36 months.
from 1 112 to
2 318  /m²
60% of transactions from the 2nd to the 8th deciles.
HousesEvolution of the price per m² of houses since...
1 year
--
2 years
--
3 years
--
4 years
--
5 years
--
6 years
--
7 years
--
8 years
--
9 years
--
10 years
--
11 years
--
ApartmentsEvolution of the price per m² of apartments since...
1 year
--
2 years
--
3 years
--
4 years
--
5 years
--
6 years
--
7 years
--
8 years
--
9 years
--
10 years
--
11 years
--

Yearly evolution

Evolution of the median price per m²

Evolution of the number of transactions

Warning, last year incomplete. Projections made based on the proportions between semesters of the previous year at the departmental/national level and by type of property.

Yearly data

Descending order
Year
Houses
house
transactions
Houses
house
Price per m²
Apartments
apt.
transactions
Apartments
apt.
Price per m²
2025
2
1 572 
0
--- 
2024
6
1 438 
0
--- 
2023
6
1 130 
0
--- 
2022
6
1 784 
0
--- 
2021
4
1 408 
0
--- 
2020
6
1 396 
0
--- 
2019
6
1 169 
0
--- 
2018
5
1 249 
0
--- 
2017
4
1 253 
0
--- 
2016
8
1 455 
1
392 
2015
4
934 
0
--- 
2014
5
1 759 
0
--- 

Analysis

Structure of prices per m²

Values of price percentiles per m² over the periods used for the estimated price of each type of property.

Structure of transaction amounts

Values of transaction amounts percentiles over the periods used for the estimated price of each type of property.

Transaction amounts and prices per m² by percentile

Ascending order
Percentile
Houses
house
Price per m²
Houses
house
Transaction amount
Apartments
apt.
Price per m²
Apartments
apt.
Transaction amount
10th percentile
911 
55 000 
392 
100 K
20th percentile
1 112 
60 000 
392 
100 K
30th percentile
1 337 
63 810 
392 
100 K
40th percentile
1 438 
137 K
392 
100 K
50th percentile
1 528 
151 K
392 
100 K
60th percentile
1 611 
161 K
392 
100 K
70th percentile
1 767 
168 K
392 
100 K
80th percentile
2 318 
193 K
392 
100 K
90th percentile
2 495 
241 K
392 
100 K

National and departmental comparison

Evolution of the median price per m² of houses

Evolution of the median price per m² of apartments

Quarterly evolution

Evolution of the median price per m²

Evolution of the number of transactions

Quarterly data

Descending order
Quarter
Houses
house
transactions
Houses
house
Price per m²
Apartments
apt.
transactions
Apartments
apt.
Price per m²
2025 Q2
1
1 587 
0
--- 
2025 Q1
1
1 557 
0
--- 
2024 Q4
2
1 994 
0
--- 
2024 Q3
1
896 
0
--- 
2024 Q2
2
1 574 
0
--- 
2024 Q1
1
1 333 
0
--- 
2023 Q4
1
1 222 
0
--- 
2023 Q3
3
2 230 
0
--- 
2023 Q2
2
834 
0
--- 
2022 Q4
3
1 709 
0
--- 
2022 Q3
1
2 513 
0
--- 
2022 Q2
2
1 024 
0
--- 
2021 Q2
3
1 576 
0
--- 
2021 Q1
1
994 
0
--- 
2020 Q4
4
1 145 
0
--- 
2020 Q3
1
1 333 
0
--- 
2020 Q2
1
1 458 
0
--- 
2019 Q4
2
1 723 
0
--- 
2019 Q2
4
515 
0
--- 
2018 Q4
2
1 624 
0
--- 
2018 Q3
2
765 
0
--- 
2018 Q1
1
1 934 
0
--- 
2017 Q3
2
1 253 
0
--- 
2017 Q2
1
444 
0
--- 
2017 Q1
1
2 733 
0
--- 
2016 Q4
2
1 800 
0
--- 
2016 Q3
3
1 310 
0
--- 
2016 Q2
2
888 
1
392 
2016 Q1
1
1 865 
0
--- 
2015 Q4
1
233 
0
--- 
2015 Q3
2
1 464 
0
--- 
2015 Q2
1
667 
0
--- 
2014 Q4
2
2 252 
0
--- 
2014 Q2
1
1 986 
0
--- 
2014 Q1
2
1 084 
0
--- 

Ardèche (07)

Most expensive cities

City
name
Descending orderHouses
house
Price per m²
3 539 
3 238 
3 111 
3 110 
3 088 
3 071 
2 873 
2 862 
City
name
Descending orderApartments
apt.
Price per m²
15 789 
3 723 
3 396 
3 393 
3 104 
2 882 
2 835 
2 698 
2 676 

Least expensive cities

City
name
Ascending orderHouses
house
Price per m²
469 
580 
720 
860 
963 
1 000 
City
name
Ascending orderApartments
apt.
Price per m²
205 
263 
269 
331 
349 
355