Median price of real estate
in the municipality of Labégude
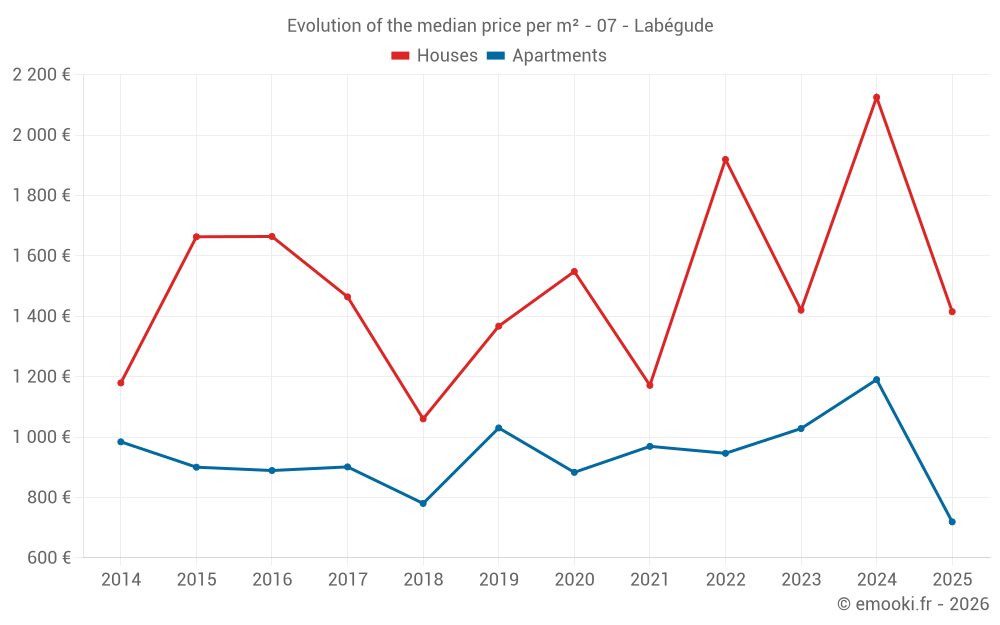
Houses
1 415 € /m²
Reliability 8/10
Median price on the 17 transactions of the last 12 months.
from 1 154 to
2 139 € /m²
2 139 € /m²
60% of transactions from the 2nd to the 8th deciles.
Apartments
860 € /m²
Reliability 7/10
Median price on the 19 transactions of the last 24 months.
from 687 to
1 190 € /m²
1 190 € /m²
60% of transactions from the 2nd to the 8th deciles.
Dwellings
1 245 € /m²
Reliability 8/10
Median price on the 25 transactions of the last 12 months.
from 855 to
2 046 € /m²
2 046 € /m²
60% of transactions from the 2nd to the 8th deciles.