Median price of real estate
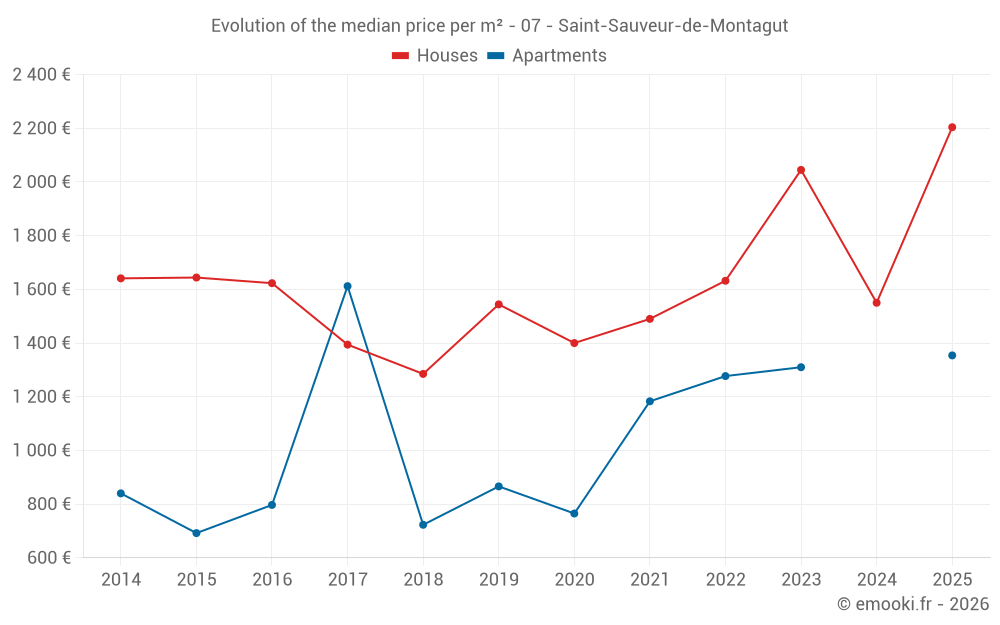
in the municipality of Saint-Sauveur-de-Montagut
Houses
1 810 € /m²
Reliability 7/10
Median price on the 14 transactions of the last 24 months.
from 1 139 to
2 189 € /m²
2 189 € /m²
60% of transactions from the 2nd to the 8th deciles.
Apartments
1 230 € /m²
Reliability 3/10
Median price on the 8 transactions of the last 72 months.
Dwellings
1 681 € /m²
Reliability 7/10
Median price on the 15 transactions of the last 24 months.
from 1 230 to
2 161 € /m²
2 161 € /m²
60% of transactions from the 2nd to the 8th deciles.