emooki
HomePrice mapTransactions
🇬🇧 English🇫🇷 Français🇩🇪 Deutsch🇪🇸 Español🇮🇹 Italiano

Real estate price map


Real estate price map in the municipality of Peaugres, choose a section to see transactions by parcel.

Ardèche (07)

Peaugres - Real estate price m²

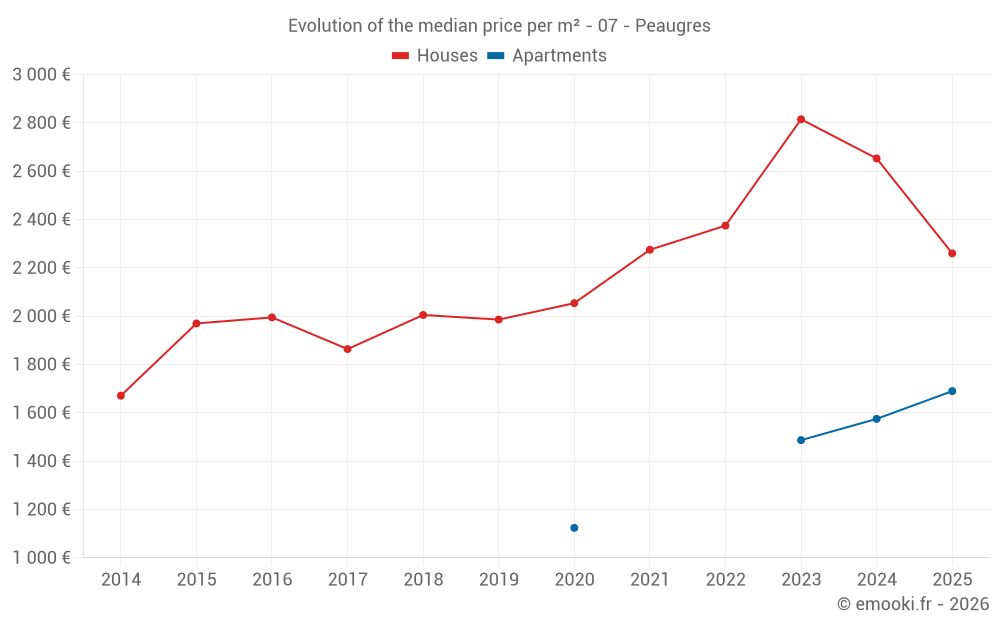
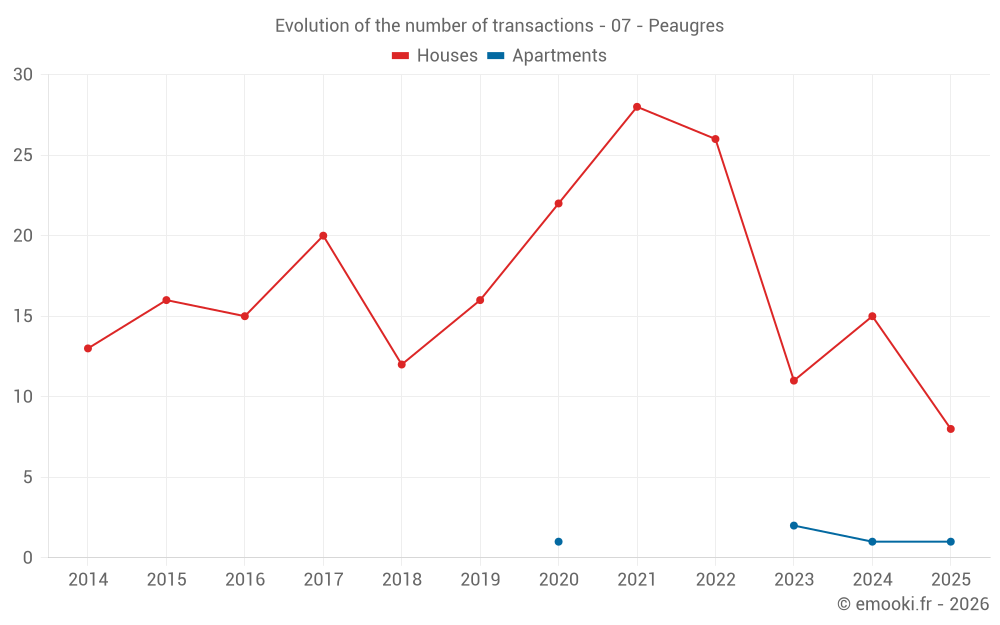
Median price of real estate
in the municipality of Peaugres

HousesHouses
2 539  /m²
1-23-45-67-89-10
Reliability 8/10
Median price on the 18 transactions of the last 12 months.
from 1 804 to
3 273  /m²
60% of transactions from the 2nd to the 8th deciles.
ApartmentsApartments
1 488  /m²
1-23-45-67-89-10
Reliability 2/10
Median price on the 5 transactions of the last 96 months.
DwellingsDwellings
2 456  /m²
1-23-45-67-89-10
Reliability 8/10
Median price on the 19 transactions of the last 12 months.
from 1 725 to
3 218  /m²
60% of transactions from the 2nd to the 8th deciles.
HousesEvolution of the price per m² of houses since...
1 year
-15%
2 years
-20%
3 years
-4.8%
4 years
-0.7%
5 years
+10%
6 years
+14%
7 years
+13%
8 years
+21%
9 years
+13%
10 years
+15%
11 years
+35%
The price per m² of houses has decreased by 20% since 2 years, but it has increased by 35% in 11 years.

Yearly evolution

Evolution of the median price per m²

Evolution of the median price per m² - 07 - Peaugres

Evolution of the number of transactions

Warning, last year incomplete. Projections made based on the proportions between semesters of the previous year at the departmental/national level and by type of property.

Evolution of the number of transactions - 07 - Peaugres

Yearly data

Descending order
Year
Houses
house
transactions
Houses
house
Price per m²
Apartments
apt.
transactions
Apartments
apt.
Price per m²
2025
8
2 260 
1
1 690 
2024
15
2 653 
1
1 575 
2023
11
2 815 
2
1 487 
2022
26
2 375 
0
--- 
2021
28
2 275 
0
--- 
2020
22
2 054 
1
1 124 
2019
16
1 986 
0
--- 
2018
12
2 005 
0
--- 
2017
20
1 864 
0
--- 
2016
15
1 995 
0
--- 
2015
16
1 970 
0
--- 
2014
13
1 671 
0
--- 

Analysis

Structure of prices per m²

Values of price percentiles per m² over the periods used for the estimated price of each type of property.

Structure of transaction amounts

Values of transaction amounts percentiles over the periods used for the estimated price of each type of property.

Transaction amounts and prices per m² by percentile

Ascending order
Percentile
Houses
house
Price per m²
Houses
house
Transaction amount
Apartments
apt.
Price per m²
Apartments
apt.
Transaction amount
10th percentile
1 628 
143 K
1 269 
80 656 
20th percentile
1 804 
218 K
1 414 
82 547 
30th percentile
2 256 
246 K
1 486 
87 928 
40th percentile
2 394 
259 K
1 487 
96 800 
50th percentile
2 539 
282 K
1 488 
106 K
60th percentile
2 684 
298 K
1 523 
111 K
70th percentile
2 934 
313 K
1 558 
117 K
80th percentile
3 273 
336 K
1 598 
186 K
90th percentile
3 708 
353 K
1 644 
319 K

National and departmental comparison

Evolution of the median price per m² of houses

Evolution of the median price per m² of apartments

Quarterly evolution

Evolution of the median price per m²

Evolution of the number of transactions

Quarterly data

Descending order
Quarter
Houses
house
transactions
Houses
house
Price per m²
Apartments
apt.
transactions
Apartments
apt.
Price per m²
2025 Q2
2
2 260 
0
--- 
2025 Q1
6
2 172 
1
1 690 
2024 Q4
7
2 948 
0
--- 
2024 Q3
3
2 808 
0
--- 
2024 Q2
3
2 603 
0
--- 
2024 Q1
2
2 371 
1
1 575 
2023 Q4
2
2 610 
0
--- 
2023 Q3
3
2 972 
2
1 487 
2023 Q2
3
2 808 
0
--- 
2023 Q1
3
2 286 
0
--- 
2022 Q4
5
2 043 
0
--- 
2022 Q3
7
2 421 
0
--- 
2022 Q2
5
2 295 
0
--- 
2022 Q1
9
2 375 
0
--- 
2021 Q4
9
2 036 
0
--- 
2021 Q3
7
2 466 
0
--- 
2021 Q2
3
2 198 
0
--- 
2021 Q1
9
2 429 
0
--- 
2020 Q4
7
1 660 
1
1 124 
2020 Q3
6
1 738 
0
--- 
2020 Q2
3
2 262 
0
--- 
2020 Q1
6
2 306 
0
--- 
2019 Q4
4
2 067 
0
--- 
2019 Q3
5
1 642 
0
--- 
2019 Q2
2
2 120 
0
--- 
2019 Q1
5
1 983 
0
--- 
2018 Q4
4
1 962 
0
--- 
2018 Q3
4
2 331 
0
--- 
2018 Q2
1
1 039 
0
--- 
2018 Q1
3
1 857 
0
--- 
2017 Q4
8
1 552 
0
--- 
2017 Q3
7
2 070 
0
--- 
2017 Q2
4
1 049 
0
--- 
2017 Q1
1
1 229 
0
--- 
2016 Q4
7
2 031 
0
--- 
2016 Q2
5
1 417 
0
--- 
2016 Q1
3
2 243 
0
--- 
2015 Q4
6
2 075 
0
--- 
2015 Q3
5
1 848 
0
--- 
2015 Q2
5
2 217 
0
--- 
2014 Q4
3
2 261 
0
--- 
2014 Q3
2
1 554 
0
--- 
2014 Q2
2
1 641 
0
--- 
2014 Q1
6
1 718 
0
--- 

Overview of the latest real estate transactions

The following list is an anonymized overview of the latest transactions. For more details and to find all transactions, please use the map to view transactions by plot or the transaction search page for a search by criteria.

2025-05-19
293 200 
2 255  /m²(130 m²)
Sale
Houses
House
5 rooms
130 m2
Land
706 m2
-Sols
2025-05-09
342 000 
2 265  /m²(151 m²)
Sale
Houses
House
4 rooms
151 m2
Land
506 m2
-Sols
Land
620 m2
-Jardins
2025-04-18
1 600 
Sale
Land
1345 m2
-Prés
Land
1123 m2
-Prés
2025-03-31
1 000 
Sale
Land
1777 m2
-Prés
2025-03-27
150 
Exchange
Land
3 m2
-Sols
Land
2 m2
-Sols
Land
3 m2
-Sols
2025-03-10
80 000 
1 600  /m²(50 m²)
Sale
Houses
House
3 rooms
50 m2
Land
106 m2
-Sols
Land
20 m2
-Landes
2025-03-07
384 350 
3 922  /m²(98 m²)
Sale
Houses
House
4 rooms
98 m2
2 outbuildings
Land
500 m2
-Sols
Land
2490 m2
-Terrains d'agrément
Land
618 m2
-Sols
2025-03-01
297 200 
1 748  /m²(170 m²)
Sale
Houses
House
5 rooms
170 m2
1 outbuilding
Land
774 m2
-Sols
2025-02-07
120 010 
1 690  /m²(71 m²)
Sale
Apartments
Apartment
3 rooms
71 m2
1 outbuilding
2025-02-06
170 000 
1 889  /m²(90 m²)
Sale
Houses
House
4 rooms
90 m2
Land
668 m2
-Sols
Land
869 m2
-Jardins
2025-01-31
327 750 
2 622  /m²(125 m²)
Sale
Houses
House
4 rooms
125 m2
Land
550 m2
-Sols
2025-01-31
302 100 
2 456  /m²(123 m²)
Sale
Houses
House
5 rooms
123 m2
Land
651 m2
-Sols
2025-01-29
83 500 
Sale
Land
51 m2
-Sols
Land
186 m2
-Sols
2025-01-28
170 000 
Sale
Land
1402 m2
-Vignes
2024-12-19
345 000 
3 382  /m²(102 m²)
Sale
Land
39 m2
-Prés
Houses
House
4 rooms
102 m2
1 outbuilding
Land
497 m2
-Sols
Land
124 m2
-Sols
2024-12-09
236 500 
3 695  /m²(64 m²)
Sale
Houses
House
3 rooms
64 m2
Land
500 m2
-Sols
Land
948 m2
-Jardins
2024-11-28
271 200 
2 948  /m²(92 m²)
Sale
Houses
House
4 rooms
92 m2
Land
1000 m2
-Sols
Land
500 m2
-Jardins
Land
415 m2
-Sols
2024-11-25
205 000 
1 640  /m²(125 m²)
Sale
Houses
House
4 rooms
125 m2
Land
282 m2
-Terrains à bâtir
Land
1 m2
-Sols
Land
21 m2
-Sols
2024-11-20
64 000 
529  /m²(121 m²)
Sale
Houses
House
6 rooms
121 m2
Land
1500 m2
-Sols
Land
4980 m2
-Terrains d'agrément
2024-11-12
260 000 
2 653  /m²(98 m²)
Sale
Houses
House
4 rooms
98 m2
Land
765 m2
-Sols
450 transactions listed in the municipality

Ardèche (07)

Most expensive cities

City
name
Descending orderHouses
house
Price per m²
3 539 
3 238 
3 111 
3 110 
3 088 
3 071 
2 873 
2 862 
City
name
Descending orderApartments
apt.
Price per m²
15 789 
3 723 
3 396 
3 393 
3 104 
2 882 
2 835 
2 698 
2 676 

Least expensive cities

City
name
Ascending orderHouses
house
Price per m²
469 
580 
720 
860 
963 
1 000 
City
name
Ascending orderApartments
apt.
Price per m²
205 
263 
269 
331 
349 
355