Median price of real estate
in the municipality of Largentière
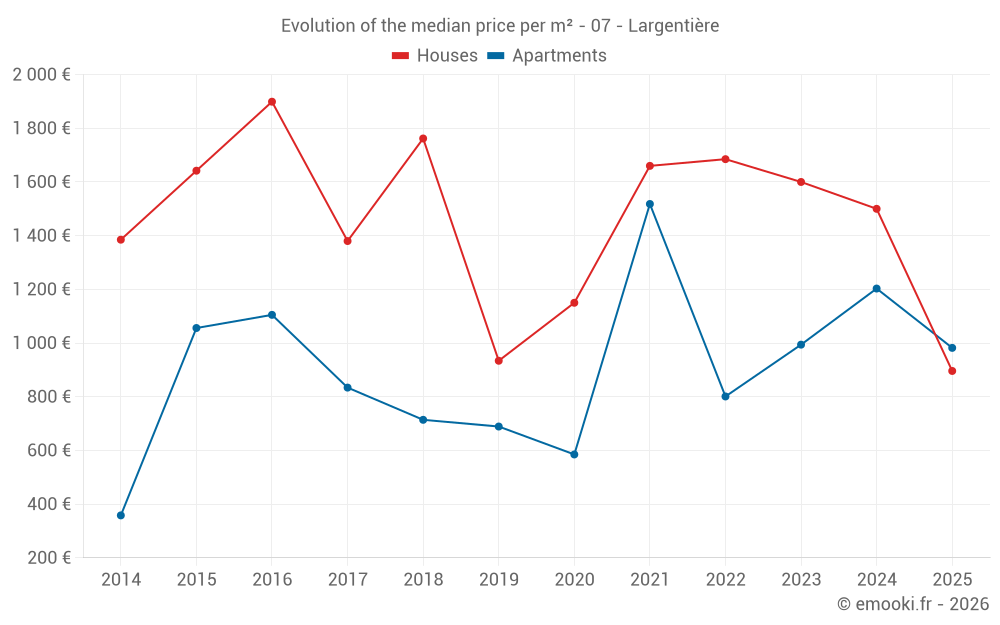
Houses
1 496 € /m²
Reliability 7/10
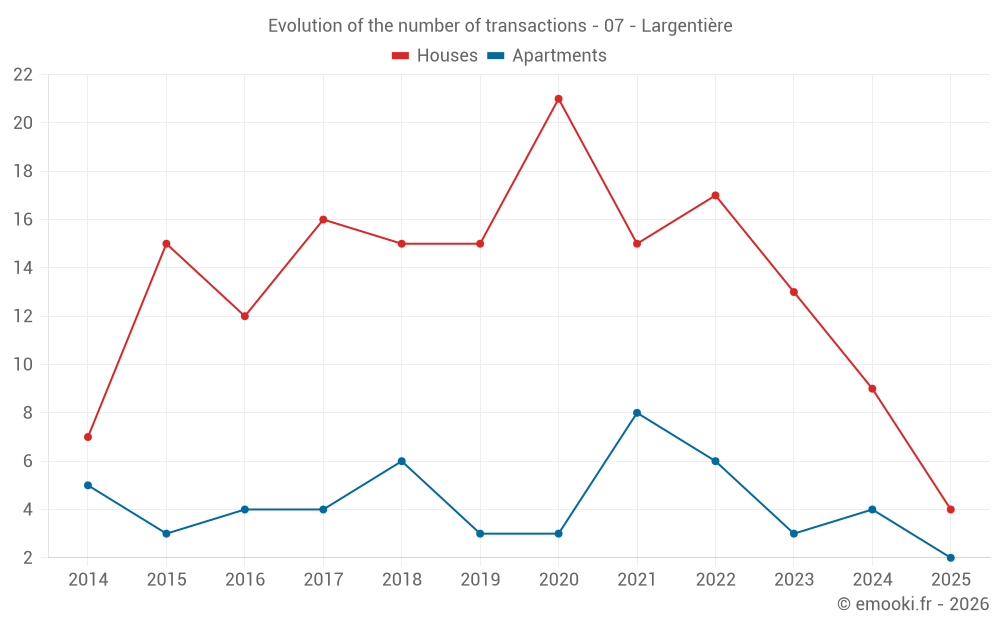
Median price on the 20 transactions of the last 24 months.
from 887 to
2 323 € /m²
2 323 € /m²
60% of transactions from the 2nd to the 8th deciles.
Apartments
929 € /m²
Reliability 5/10
Median price on the 20 transactions of the last 48 months.
from 724 to
1 820 € /m²
1 820 € /m²
60% of transactions from the 2nd to the 8th deciles.
Dwellings
1 474 € /m²
Reliability 7/10
Median price on the 28 transactions of the last 24 months.
from 791 to
2 137 € /m²
2 137 € /m²
60% of transactions from the 2nd to the 8th deciles.