emooki
HomePrice mapTransactions
🇬🇧 English🇫🇷 Français🇩🇪 Deutsch🇪🇸 Español🇮🇹 Italiano

Real estate price map


Real estate price map in the municipality of Chomérac, choose a section to see transactions by parcel.

Ardèche (07)
Chomérac

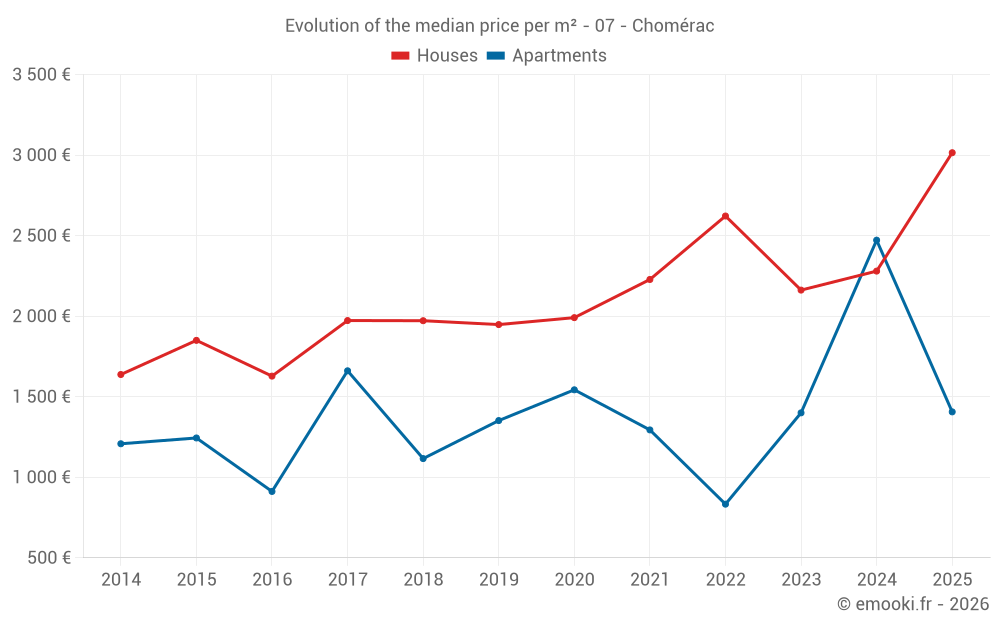
Median price of real estate
in the municipality of Chomérac

HousesHouses
2 460  /m²
1-23-45-67-89-10
Reliability 8/10
Median price on the 17 transactions of the last 12 months.
from 1 607 to
2 986  /m²
60% of transactions from the 2nd to the 8th deciles.
ApartmentsApartments
1 604  /m²
1-23-45-67-89-10
Reliability 7/10
Median price on the 16 transactions of the last 24 months.
from 1 023 to
3 043  /m²
60% of transactions from the 2nd to the 8th deciles.
DwellingsDwellings
2 011  /m²
1-23-45-67-89-10
Reliability 8/10
Median price on the 29 transactions of the last 12 months.
from 1 323 to
2 957  /m²
60% of transactions from the 2nd to the 8th deciles.
HousesEvolution of the price per m² of houses since...
1 year
+32%
2 years
+39%
3 years
+15%
4 years
+35%
5 years
+51%
6 years
+55%
7 years
+53%
8 years
+53%
9 years
+85%
10 years
+63%
11 years
+84%
ApartmentsEvolution of the price per m² of apartments since...
1 year
-43%
2 years
+0.4%
3 years
+69%
4 years
+8.7%
5 years
-8.9%
6 years
+4%
7 years
+26%
8 years
-15%
9 years
+54%
10 years
+13%
11 years
+16%
The price per m² of apartments has decreased by 43% since 1 year, but it has increased by 69% in 3 years.

Yearly evolution

Evolution of the median price per m²

Evolution of the median price per m² - 07 - Chomérac

Evolution of the number of transactions

Warning, last year incomplete. Projections made based on the proportions between semesters of the previous year at the departmental/national level and by type of property.

Yearly data

Descending order
Year
Houses
house
transactions
Houses
house
Price per m²
Apartments
apt.
transactions
Apartments
apt.
Price per m²
2025
5
3 015 
4
1 406 
2024
25
2 280 
10
2 472 
2023
32
2 162 
6
1 400 
2022
28
2 622 
5
833 
2021
38
2 228 
8
1 294 
2020
20
1 991 
7
1 543 
2019
31
1 948 
5
1 352 
2018
28
1 972 
4
1 116 
2017
21
1 973 
4
1 661 
2016
22
1 628 
7
912 
2015
21
1 850 
10
1 244 
2014
21
1 638 
8
1 208 

Analysis

Structure of prices per m²

Values of price percentiles per m² over the periods used for the estimated price of each type of property.

Structure of transaction amounts

Values of transaction amounts percentiles over the periods used for the estimated price of each type of property.

Transaction amounts and prices per m² by percentile

Ascending order
Percentile
Houses
house
Price per m²
Houses
house
Transaction amount
Apartments
apt.
Price per m²
Apartments
apt.
Transaction amount
10th percentile
1 054 
99 600 
956 
60 500 
20th percentile
1 607 
143 K
1 023 
90 000 
30th percentile
1 849 
156 K
1 326 
106 K
40th percentile
2 002 
192 K
1 400 
120 K
50th percentile
2 460 
205 K
1 604 
154 K
60th percentile
2 633 
238 K
2 472 
220 K
70th percentile
2 924 
268 K
2 490 
245 K
80th percentile
2 986 
324 K
3 043 
272 K
90th percentile
3 097 
348 K
3 080 
279 K

National and departmental comparison

Evolution of the median price per m² of houses

Evolution of the median price per m² of apartments

Quarterly evolution

Evolution of the median price per m²

Evolution of the number of transactions

Quarterly data

Descending order
Quarter
Houses
house
transactions
Houses
house
Price per m²
Apartments
apt.
transactions
Apartments
apt.
Price per m²
2025 Q2
3
1 996 
0
--- 
2025 Q1
2
5 548 
4
1 406 
2024 Q4
6
2 616 
5
1 400 
2024 Q3
6
1 960 
3
3 043 
2024 Q2
7
2 682 
2
3 108 
2024 Q1
6
1 396 
0
--- 
2023 Q4
8
2 552 
1
1 312 
2023 Q3
8
1 690 
1
1 023 
2023 Q2
6
2 451 
2
988 
2023 Q1
10
2 222 
2
1 908 
2022 Q4
7
2 642 
2
1 369 
2022 Q3
10
2 208 
1
782 
2022 Q2
8
2 676 
2
1 198 
2022 Q1
3
2 800 
0
--- 
2021 Q4
7
2 250 
2
1 152 
2021 Q3
12
2 042 
1
1 438 
2021 Q2
10
2 210 
1
706 
2021 Q1
9
2 206 
4
1 400 
2020 Q4
7
2 041 
2
1 590 
2020 Q3
3
2 433 
2
924 
2020 Q2
4
2 310 
1
1 712 
2020 Q1
6
1 702 
2
855 
2019 Q4
7
2 242 
2
1 252 
2019 Q3
10
1 716 
2
1 164 
2019 Q2
4
1 452 
1
1 352 
2019 Q1
10
2 164 
0
--- 
2018 Q4
11
1 845 
2
1 304 
2018 Q3
8
1 918 
0
--- 
2018 Q2
5
2 082 
1
1 035 
2018 Q1
4
2 093 
1
511 
2017 Q4
3
2 079 
0
--- 
2017 Q3
8
1 801 
2
1 661 
2017 Q2
5
1 996 
1
3 125 
2017 Q1
5
2 000 
1
1 302 
2016 Q4
5
1 752 
2
1 046 
2016 Q3
3
1 859 
1
1 413 
2016 Q2
9
1 597 
3
500 
2016 Q1
5
1 359 
1
1 205 
2015 Q4
4
1 862 
5
778 
2015 Q3
7
1 906 
3
1 293 
2015 Q2
5
1 638 
1
1 200 
2015 Q1
5
2 145 
1
1 287 
2014 Q4
7
2 048 
0
--- 
2014 Q3
4
1 888 
1
1 301 
2014 Q2
5
1 384 
5
1 116 
2014 Q1
5
1 577 
2
1 131 

Overview of the latest real estate transactions

The following list is an anonymized overview of the latest transactions. For more details and to find all transactions, please use the map to view transactions by plot or the transaction search page for a search by criteria.

2025-05-21
9 312 
Sale
Land
11640 m2
-Terres
2025-05-14
205 550 
1 996  /m²(103 m²)
Sale
Houses
House
6 rooms
103 m2
2025-04-14
293 000 
3 220  /m²(91 m²)
Sale
Houses
House
4 rooms
91 m2
1 outbuilding
Land
380 m2
-Sols
2025-04-04
50 000 
1 613  /m²(31 m²)
Sale
Houses
House
3 rooms
31 m2
Land
31 m2
-Sols
2025-03-31
25 420 
1 017  /m²(25 m²)
Sale
Apartments
Apartment
1 room
25 m2
Land
36 m2
-Sols
1 outbuilding
Land
11 m2
-Sols
2025-03-21
93 333 
626  /m²(149 m²)
Sale
Apartments
Apartment
1 room
30 m2
Apartments
Apartment
5 rooms
119 m2
1 outbuilding
Land
1570 m2
-Sols
2025-03-14
75 600 
Sale
Land
441 m2
-Terrains à bâtir
2025-03-11
138 000 
2 509  /m²(55 m²)
Sale
Apartments
Apartment
1 room
20 m2
Apartments
Apartment
2 rooms
35 m2
Land
115 m2
-Sols
2025-03-10
202 000 
8 080  /m²(25 m²)
Sale
Houses
House
4 rooms
25 m2
Land
485 m2
-Sols
Land
878 m2
-Sols
2025-03-07
50 
Sale
Land
5 m2
-Sols
2025-02-21
55 000 
Sale
Land
522 m2
-Terres
2025-02-21
38 000 
Sale
4 outbuildings
2025-01-30
61 500 
Sale
Land
332 m2
-Terrains à bâtir
2025-01-29
67 000 
Sale
Land
358 m2
-Terrains à bâtir
2025-01-28
100 
Exchange
Land
370 m2
-Prés
Land
124 m2
-Landes
2025-01-28
6 000 
Sale
Land
692 m2
-Jardins
Land
270 m2
-Jardins
2025-01-28
6 000 
Sale
Land
390 m2
-Landes
Land
120 m2
-Jardins
2025-01-24
118 500 
1 795  /m²(66 m²)
Sale
1 outbuilding
Apartments
Apartment
3 rooms
66 m2
1 outbuilding
2025-01-15
331 650 
3 015  /m²(110 m²)
Sale
Houses
House
5 rooms
110 m2
Land
354 m2
-Sols
Land
1188 m2
-Landes
/Pâture plantée
Land
1315 m2
-Vignes
2024-12-23
35 000 
1 400  /m²(25 m²)
Sale
Apartments
Apartment
2 rooms
25 m2
1 outbuilding
Land
30 m2
-Sols
700 transactions listed in the municipality

Ardèche (07)

Most expensive cities

City
name
Descending orderHouses
house
Price per m²
3 539 
3 238 
3 111 
3 110 
3 088 
3 071 
2 873 
2 862 
City
name
Descending orderApartments
apt.
Price per m²
15 789 
3 723 
3 396 
3 393 
3 104 
2 882 
2 835 
2 698 
2 676 

Least expensive cities

City
name
Ascending orderHouses
house
Price per m²
469 
580 
720 
860 
963 
1 000 
City
name
Ascending orderApartments
apt.
Price per m²
205 
263 
269 
331 
349 
355