emooki
HomePrice mapTransactions
🇬🇧 English🇫🇷 Français🇩🇪 Deutsch🇪🇸 Español🇮🇹 Italiano

Real estate price map


Real estate price map in the municipality of Villejuif, choose a section to see transactions by parcel.

Val-de-Marne (94)

Villejuif - Real estate price m²

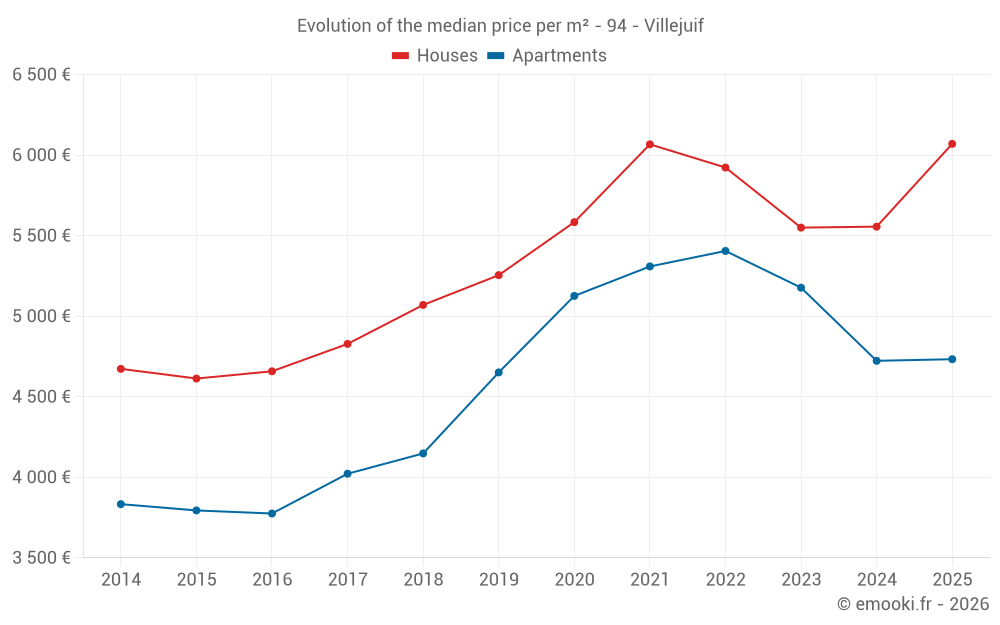
Median price of real estate
in the municipality of Villejuif

HousesHouses
6 070  /m²
1-23-45-67-89-10
Reliability 9/10
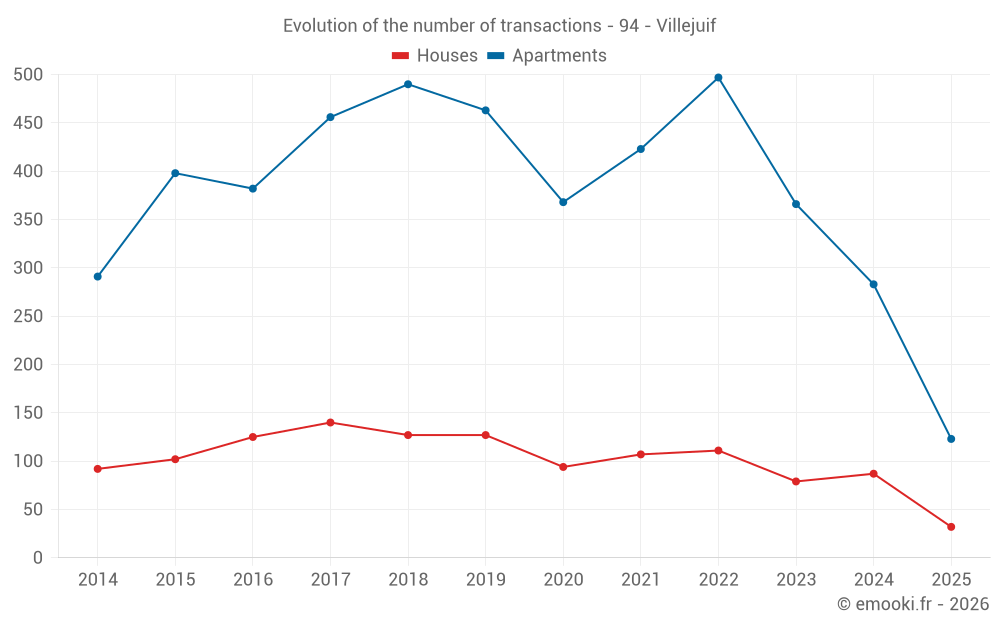
Median price on the 32 transactions of the last 6 months.
from 5 139 to
6 680  /m²
60% of transactions from the 2nd to the 8th deciles.
ApartmentsApartments
4 550  /m²
1-23-45-67-89-10
Reliability 10/10
Median price on the 38 transactions of the last 3 months.
from 3 734 to
6 003  /m²
60% of transactions from the 2nd to the 8th deciles.
DwellingsDwellings
5 063  /m²
1-23-45-67-89-10
Reliability 10/10
Median price on the 51 transactions of the last 3 months.
from 3 933 to
6 457  /m²
60% of transactions from the 2nd to the 8th deciles.
HousesEvolution of the price per m² of houses since...
1 year
+9.3%
2 years
+9.4%
3 years
+2.5%
4 years
+0%
5 years
+8.7%
6 years
+16%
7 years
+20%
8 years
+26%
9 years
+30%
10 years
+32%
11 years
+30%
ApartmentsEvolution of the price per m² of apartments since...
1 year
+0.2%
2 years
-8.6%
3 years
-12%
4 years
-11%
5 years
-7.7%
6 years
+1.8%
7 years
+14%
8 years
+18%
9 years
+25%
10 years
+25%
11 years
+23%
The price per m² of apartments has decreased by 12% since 3 years, but it has increased by 25% in 9 years.

Yearly evolution

Evolution of the median price per m²

Evolution of the median price per m² - 94 - Villejuif

Evolution of the number of transactions

Warning, last year incomplete. Projections made based on the proportions between semesters of the previous year at the departmental/national level and by type of property.

Evolution of the number of transactions - 94 - Villejuif

Yearly data

Descending order
Year
Houses
house
transactions
Houses
house
Price per m²
Apartments
apt.
transactions
Apartments
apt.
Price per m²
2025
32
6 070 
123
4 733 
2024
87
5 556 
283
4 723 
2023
79
5 550 
366
5 177 
2022
111
5 923 
497
5 405 
2021
107
6 067 
423
5 309 
2020
94
5 584 
368
5 126 
2019
127
5 255 
463
4 651 
2018
127
5 070 
490
4 148 
2017
140
4 828 
456
4 022 
2016
125
4 658 
382
3 775 
2015
102
4 613 
398
3 794 
2014
92
4 673 
291
3 833 

Analysis

Structure of prices per m²

Values of price percentiles per m² over the periods used for the estimated price of each type of property.

Structure of transaction amounts

Values of transaction amounts percentiles over the periods used for the estimated price of each type of property.

Transaction amounts and prices per m² by percentile

Ascending order
Percentile
Houses
house
Price per m²
Houses
house
Transaction amount
Apartments
apt.
Price per m²
Apartments
apt.
Transaction amount
10th percentile
4 219 
302 K
3 157 
127 K
20th percentile
5 139 
330 K
3 734 
165 K
30th percentile
5 644 
384 K
3 956 
184 K
40th percentile
5 867 
411 K
4 222 
204 K
50th percentile
6 070 
497 K
4 550 
206 K
60th percentile
6 203 
556 K
4 826 
222 K
70th percentile
6 298 
626 K
5 545 
286 K
80th percentile
6 680 
665 K
6 003 
326 K
90th percentile
7 780 
740 K
6 646 
360 K

National and departmental comparison

Evolution of the median price per m² of houses

Evolution of the median price per m² of apartments

Quarterly evolution

Evolution of the median price per m²

Evolution of the number of transactions

Quarterly data

Descending order
Quarter
Houses
house
transactions
Houses
house
Price per m²
Apartments
apt.
transactions
Apartments
apt.
Price per m²
2025 Q2
13
6 203 
38
4 550 
2025 Q1
19
6 059 
85
4 902 
2024 Q4
19
5 769 
71
4 697 
2024 Q3
26
5 688 
75
4 640 
2024 Q2
21
5 511 
72
4 816 
2024 Q1
21
5 522 
65
4 783 
2023 Q4
16
4 862 
72
4 842 
2023 Q3
28
5 769 
82
4 945 
2023 Q2
18
4 947 
109
5 373 
2023 Q1
17
5 742 
103
5 207 
2022 Q4
25
5 645 
149
5 584 
2022 Q3
24
5 980 
136
5 443 
2022 Q2
33
5 781 
120
5 153 
2022 Q1
29
6 000 
92
5 222 
2021 Q4
23
5 897 
121
5 385 
2021 Q3
30
6 321 
106
5 298 
2021 Q2
37
5 776 
108
5 370 
2021 Q1
17
6 310 
88
5 090 
2020 Q4
31
5 760 
114
5 036 
2020 Q3
14
6 121 
90
5 128 
2020 Q2
27
5 224 
69
5 090 
2020 Q1
22
6 036 
95
5 300 
2019 Q4
35
5 446 
128
5 032 
2019 Q3
29
5 478 
120
4 636 
2019 Q2
34
5 221 
102
4 531 
2019 Q1
29
5 166 
113
4 226 
2018 Q4
41
5 070 
134
4 338 
2018 Q3
39
5 320 
129
4 263 
2018 Q2
28
4 919 
115
3 979 
2018 Q1
19
5 388 
112
3 892 
2017 Q4
42
4 906 
136
3 896 
2017 Q3
38
5 335 
105
4 060 
2017 Q2
33
4 173 
112
4 012 
2017 Q1
27
4 763 
103
4 324 
2016 Q4
47
4 365 
99
3 673 
2016 Q3
36
5 126 
117
3 774 
2016 Q2
21
4 872 
84
3 824 
2016 Q1
21
4 230 
82
3 796 
2015 Q4
34
5 263 
101
3 875 
2015 Q3
30
4 309 
123
3 846 
2015 Q2
17
4 638 
87
3 739 
2015 Q1
21
4 369 
87
3 800 
2014 Q4
22
5 790 
83
3 646 
2014 Q3
26
4 636 
69
4 310 
2014 Q2
17
4 038 
59
3 659 
2014 Q1
27
4 692 
80
3 794 

Overview of the latest real estate transactions

The following list is an anonymized overview of the latest transactions. For more details and to find all transactions, please use the map to view transactions by plot or the transaction search page for a search by criteria.

2025-06-26
5 201 640 
Sale
2025-06-18
259 000 
4 047  /m²(64 m²)
Sale
Houses
House
3 rooms
64 m2
Land
300 m2
-Sols
2025-06-04
265 000 
Sale
2025-05-27
185 000 
4 625  /m²(40 m²)
Sale
Apartments
Apartment
2 rooms
40 m2
1 outbuilding
2025-05-26
10 000 
Sale
1 outbuilding
2025-05-23
230 000 
2 396  /m²(96 m²)
Sale
Apartments
Apartment
5 rooms
96 m2
2 outbuildings
2025-05-23
125 000 
7 353  /m²(17 m²)
Sale
Apartments
Apartment
1 room
17 m2
1 outbuilding
2025-05-22
400 000 
8 000  /m²(50 m²)
Sale
Commercial property
50 m2
2025-05-21
131 000 
6 550  /m²(20 m²)
Sale
Apartments
Apartment
1 room
20 m2
2025-05-21
480 000 
4 068  /m²(118 m²)
Sale
Commercial property
118 m2
2025-05-20
320 400 
4 782  /m²(67 m²)
Sale
Apartments
Apartment
3 rooms
67 m2
1 outbuilding
2025-05-16
257 000 
4 079  /m²(63 m²)
Sale
Apartments
Apartment
2 rooms
63 m2
1 outbuilding
2025-05-16
182 000 
3 872  /m²(47 m²)
Sale
Apartments
Apartment
2 rooms
47 m2
1 outbuilding
2025-05-16
380 000 
7 917  /m²(48 m²)
Sale
Houses
House
2 rooms
48 m2
Land
225 m2
-Sols
2025-05-16
128 000 
5 818  /m²(22 m²)
Sale
Apartments
Apartment
1 room
22 m2
1 outbuilding
2025-05-15
300 000 
2 885  /m²(104 m²)
Sale
Apartments
Apartment
2 rooms
50 m2
Apartments
Apartment
1 room
27 m2
Apartments
Apartment
1 room
27 m2
5 outbuildings
2025-05-14
220 000 
3 860  /m²(57 m²)
Sale
Apartments
Apartment
3 rooms
57 m2
2 outbuildings
2025-05-14
980 000 
6 203  /m²(158 m²)
Sale
Houses
House
6 rooms
109 m2
Houses
House
2 rooms
49 m2
2 outbuildings
Land
531 m2
-Sols
Land
98 m2
-Sols
2025-05-13
30 000 
Sale
1 outbuilding
2025-05-12
64 017 
2 065  /m²(31 m²)
Sale
Apartments
Apartment
2 rooms
31 m2
9351 transactions listed in the municipality

Val-de-Marne (94)

Most expensive cities

City
name
Descending orderHouses
house
Price per m²
11 952 
11 467 
8 514 
8 109 
6 752 
City
name
Descending orderApartments
apt.
Price per m²
8 716 
8 516 
5 909 
5 689 
5 638 

Least expensive cities

City
name
Ascending orderHouses
house
Price per m²
3 305 
3 308 
3 358 
3 417 
3 731 
City
name
Ascending orderApartments
apt.
Price per m²
2 916 
3 054 
3 182 
3 203 
3 293