Median price of real estate
in the municipality of Paris 19e Arrondissement
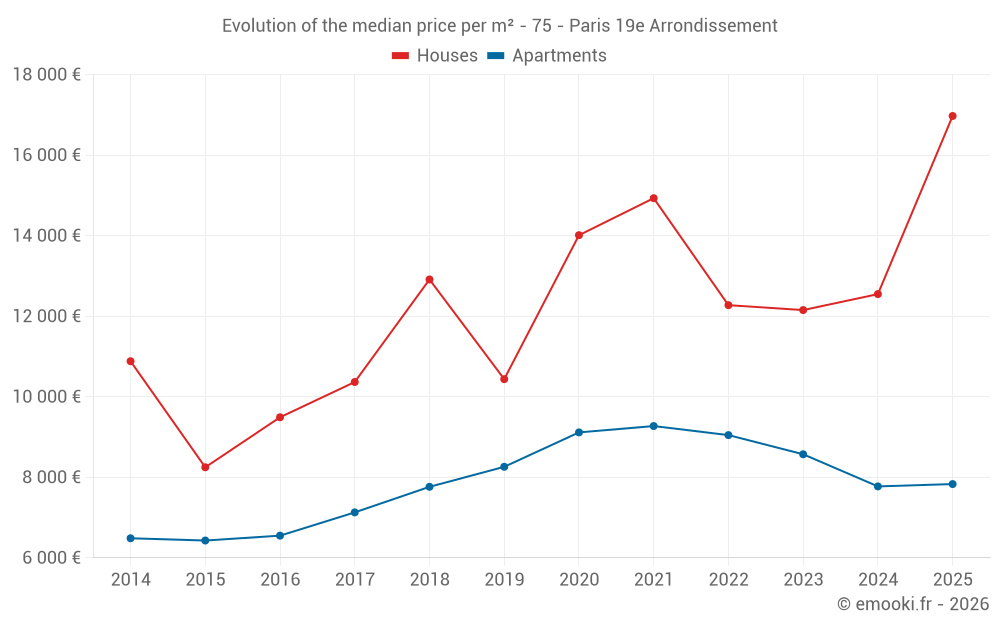
Houses
12 524 € /m²
Reliability 7/10
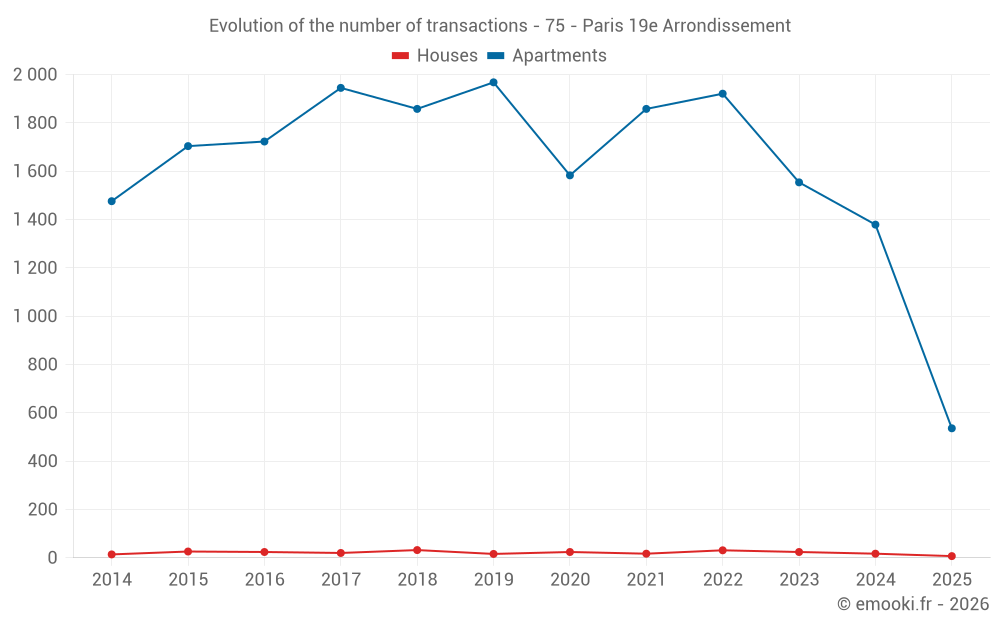
Median price on the 36 transactions of the last 24 months.
from 9 173 to
15 517 € /m²
15 517 € /m²
60% of transactions from the 2nd to the 8th deciles.
Apartments
7 468 € /m²
Reliability 10/10
Median price on the 148 transactions of the last 3 months.
from 6 266 to
9 127 € /m²
9 127 € /m²
60% of transactions from the 2nd to the 8th deciles.
Dwellings
7 500 € /m²
Reliability 10/10
Median price on the 149 transactions of the last 3 months.
from 6 274 to
9 208 € /m²
9 208 € /m²
60% of transactions from the 2nd to the 8th deciles.