emooki
HomePrice mapTransactions
🇬🇧 English🇫🇷 Français🇩🇪 Deutsch🇪🇸 Español🇮🇹 Italiano

Real estate price map


Real estate price map in the municipality of Ollières, choose a section to see transactions by parcel.

Var (83)
Ollières

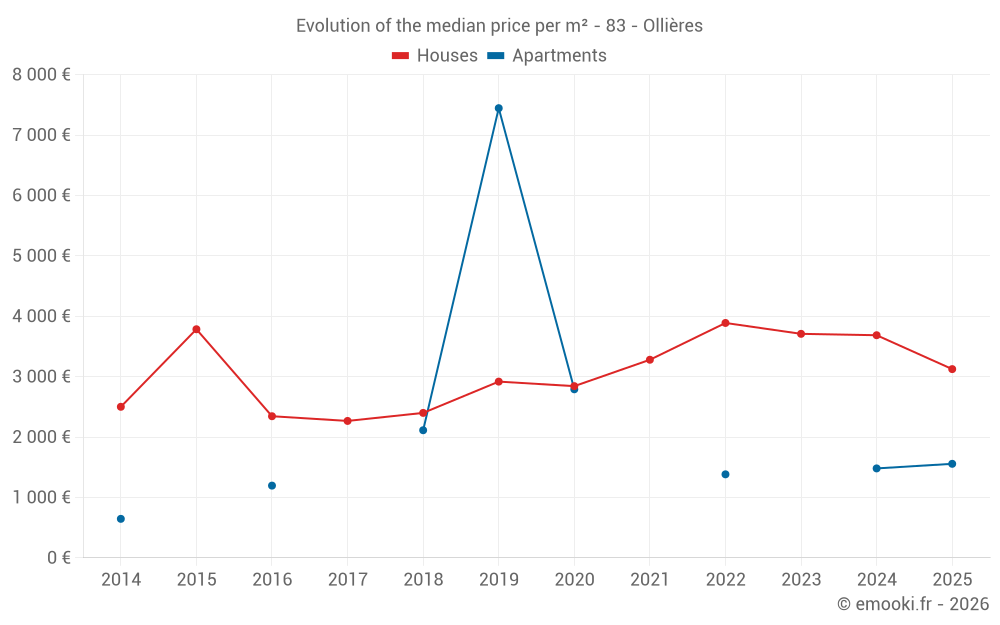
Median price of real estate
in the municipality of Ollières

HousesHouses
3 491  /m²
1-23-45-67-89-10
Reliability 6/10
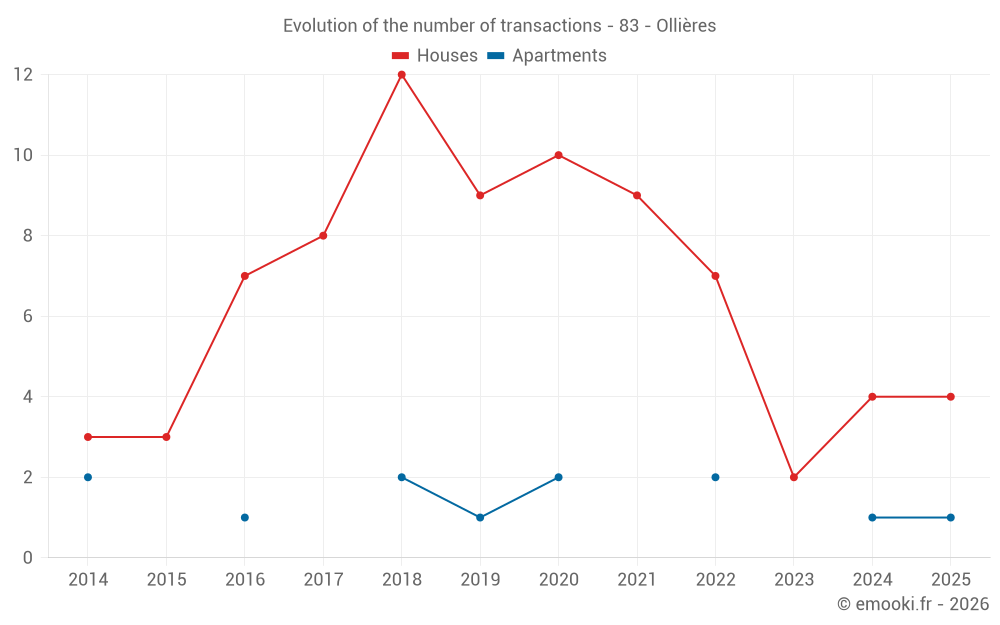
Median price on the 13 transactions of the last 36 months.
from 2 809 to
4 021  /m²
60% of transactions from the 2nd to the 8th deciles.
ApartmentsApartments
1 868  /m²
1-23-45-67-89-10
Reliability 3/10
Median price on the 6 transactions of the last 72 months.
DwellingsDwellings
3 261  /m²
1-23-45-67-89-10
Reliability 6/10
Median price on the 15 transactions of the last 36 months.
from 2 436 to
3 932  /m²
60% of transactions from the 2nd to the 8th deciles.
HousesEvolution of the price per m² of houses since...
1 year
-15%
2 years
--
3 years
-20%
4 years
-4.7%
5 years
+10%
6 years
+7.1%
7 years
+30%
8 years
+38%
9 years
+33%
10 years
--
11 years
--
The price per m² of houses has decreased by 20% since 3 years, but it has increased by 38% in 8 years.

Yearly evolution

Evolution of the median price per m²

Evolution of the number of transactions

Warning, last year incomplete. Projections made based on the proportions between semesters of the previous year at the departmental/national level and by type of property.

Yearly data

Descending order
Year
Houses
house
transactions
Houses
house
Price per m²
Apartments
apt.
transactions
Apartments
apt.
Price per m²
2025
4
3 124 
1
1 556 
2024
4
3 685 
1
1 480 
2023
2
3 708 
0
--- 
2022
7
3 888 
2
1 382 
2021
9
3 279 
0
--- 
2020
10
2 842 
2
2 790 
2019
9
2 917 
1
7 444 
2018
12
2 399 
2
2 112 
2017
8
2 266 
0
--- 
2016
7
2 344 
1
1 195 
2015
3
3 784 
0
--- 
2014
3
2 500 
2
645 

Analysis

Structure of prices per m²

Values of price percentiles per m² over the periods used for the estimated price of each type of property.

Structure of transaction amounts

Values of transaction amounts percentiles over the periods used for the estimated price of each type of property.

Transaction amounts and prices per m² by percentile

Ascending order
Percentile
Houses
house
Price per m²
Houses
house
Transaction amount
Apartments
apt.
Price per m²
Apartments
apt.
Transaction amount
10th percentile
2 548 
182 K
928 
24 500 
20th percentile
2 809 
221 K
1 480 
37 000 
30th percentile
3 091 
288 K
1 518 
51 220 
40th percentile
3 254 
300 K
1 556 
65 440 
50th percentile
3 491 
333 K
1 868 
83 720 
60th percentile
3 676 
366 K
2 181 
102 K
70th percentile
3 811 
486 K
2 285 
159 K
80th percentile
4 021 
494 K
2 389 
215 K
90th percentile
4 285 
553 K
2 894 
248 K

National and departmental comparison

Evolution of the median price per m² of houses

Evolution of the median price per m² of apartments

Quarterly evolution

Evolution of the median price per m²

Evolution of the number of transactions

Quarterly data

Descending order
Quarter
Houses
house
transactions
Houses
house
Price per m²
Apartments
apt.
transactions
Apartments
apt.
Price per m²
2025 Q2
2
2 626 
0
--- 
2025 Q1
2
5 046 
1
1 556 
2024 Q4
2
3 608 
0
--- 
2024 Q3
1
4 109 
1
1 480 
2024 Q2
1
3 261 
0
--- 
2023 Q3
1
3 655 
0
--- 
2023 Q2
1
3 760 
0
--- 
2022 Q4
1
3 888 
0
--- 
2022 Q3
2
2 710 
0
--- 
2022 Q2
1
4 079 
1
2 389 
2022 Q1
3
4 415 
1
375 
2021 Q4
1
3 937 
0
--- 
2021 Q3
4
3 009 
0
--- 
2021 Q2
1
3 417 
0
--- 
2021 Q1
3
3 068 
0
--- 
2020 Q4
2
2 640 
0
--- 
2020 Q3
3
3 169 
0
--- 
2020 Q2
3
2 385 
1
2 181 
2020 Q1
2
6 600 
1
3 400 
2019 Q4
3
3 928 
0
--- 
2019 Q3
2
3 262 
0
--- 
2019 Q2
1
975 
1
7 444 
2019 Q1
3
2 179 
0
--- 
2018 Q4
2
2 250 
1
2 625 
2018 Q3
3
2 222 
0
--- 
2018 Q2
4
2 464 
1
1 600 
2018 Q1
3
2 400 
0
--- 
2017 Q3
4
2 340 
0
--- 
2017 Q2
4
2 074 
0
--- 
2016 Q3
2
2 860 
0
--- 
2016 Q2
3
1 957 
0
--- 
2016 Q1
2
3 102 
1
1 195 
2015 Q4
1
1 247 
0
--- 
2015 Q3
1
4 857 
0
--- 
2015 Q2
1
3 784 
0
--- 
2014 Q4
1
3 449 
0
--- 
2014 Q2
2
1 962 
2
645 

Overview of the latest real estate transactions

The following list is an anonymized overview of the latest transactions. For more details and to find all transactions, please use the map to view transactions by plot or the transaction search page for a search by criteria.

2025-06-30
337 000 
2 496  /m²(135 m²)
Sale
Houses
House
5 rooms
135 m2
2 outbuildings
2025-04-22
187 500 
2 757  /m²(68 m²)
Sale
Houses
House
4 rooms
68 m2
Land
45 m2
-Sols
2025-03-18
340 000 
3 434  /m²(99 m²)
Sale
Houses
House
4 rooms
99 m2
Land
500 m2
-Sols
Land
532 m2
-Terrains d'agrément
Land
168 m2
-Vignes
2025-02-14
495 000 
6 600  /m²(75 m²)
Sale
Houses
House
3 rooms
75 m2
2 outbuildings
Land
2381 m2
-Terres
2025-01-29
4 000 
Sale
Land
6171 m2
-Taillis simples
2025-01-28
492 200 
3 491  /m²(141 m²)
Sale
Houses
House
5 rooms
141 m2
2 outbuildings
Land
500 m2
-Sols
Land
2000 m2
-Terrains d'agrément
Land
509 m2
-Landes
2025-01-14
280 000 
1 556  /m²(180 m²)
Sale
Apartments
Apartment
6 rooms
180 m2
1 outbuilding
2024-12-06
1 151 400 
4 329  /m²(266 m²)
Sale
Houses
House
6 rooms
266 m2
2 outbuildings
Land
24 m2
-Sols
Land
4976 m2
-Terres
2024-10-29
482 220 
2 888  /m²(167 m²)
Sale
Houses
House
5 rooms
167 m2
2 outbuildings
2024-09-06
37 000 
1 480  /m²(25 m²)
Sale
Apartments
Apartment
1 room
25 m2
2024-09-06
335 400 
Sale
Land
36 m2
-Landes
Land
1153 m2
-Terres
2024-08-02
131 500 
4 109  /m²(32 m²)
Sale
Houses
House
3 rooms
32 m2
2024-07-19
110 000 
Sale
Land
2235 m2
-Terres
Land
83 m2
-Terres
Land
86 m2
-Terres
Land
600 m2
-Terres
2024-05-17
300 000 
3 261  /m²(92 m²)
Sale
Houses
House
4 rooms
92 m2
Land
1096 m2
-Sols
Land
104 m2
-Sols
2024-02-15
231 000 
Sale
Land
2099 m2
-Terrains à bâtir
2023-09-12
221 000 
Sale
1 outbuilding
Land
2213 m2
-Terrains à bâtir
2023-09-11
400 
Sale
Land
1655 m2
-Sols
2023-08-31
332 631 
3 655  /m²(91 m²)
Sale
Houses
House
4 rooms
91 m2
1 outbuilding
Land
4544 m2
-Taillis simples
Land
2000 m2
-Terrains d'agrément
Land
500 m2
-Sols
2023-07-04
244 100 
Sale
Land
5 m2
-Taillis simples
2023-04-13
270 700 
3 760  /m²(72 m²)
Sale
Houses
House
3 rooms
72 m2
1 outbuilding
Land
1688 m2
-Terrains d'agrément
Land
500 m2
-Sols

Var (83)

Most expensive cities

City
name
Descending orderHouses
house
Price per m²
29 062 
20 110 
9 205 
9 164 
7 834 
7 731 
7 394 
7 043 
7 014 
City
name
Descending orderApartments
apt.
Price per m²
12 692 
10 000 
7 656 
6 722 
6 667 
6 316 
6 264 
6 083 

Least expensive cities

City
name
Ascending orderHouses
house
Price per m²
1 250 
1 531 
1 825 
1 905 
1 925 
1 952 
1 998 
2 067 
2 083 
City
name
Ascending orderApartments
apt.
Price per m²
660 
738 
923 
950 
1 015 
1 033 
1 113 
1 229