emooki
HomePrice mapTransactions
🇬🇧 English🇫🇷 Français🇩🇪 Deutsch🇪🇸 Español🇮🇹 Italiano

Real estate price map


Real estate price map in the municipality of Carqueiranne, choose a section to see transactions by parcel.

Var (83)

Carqueiranne - Real estate price m²

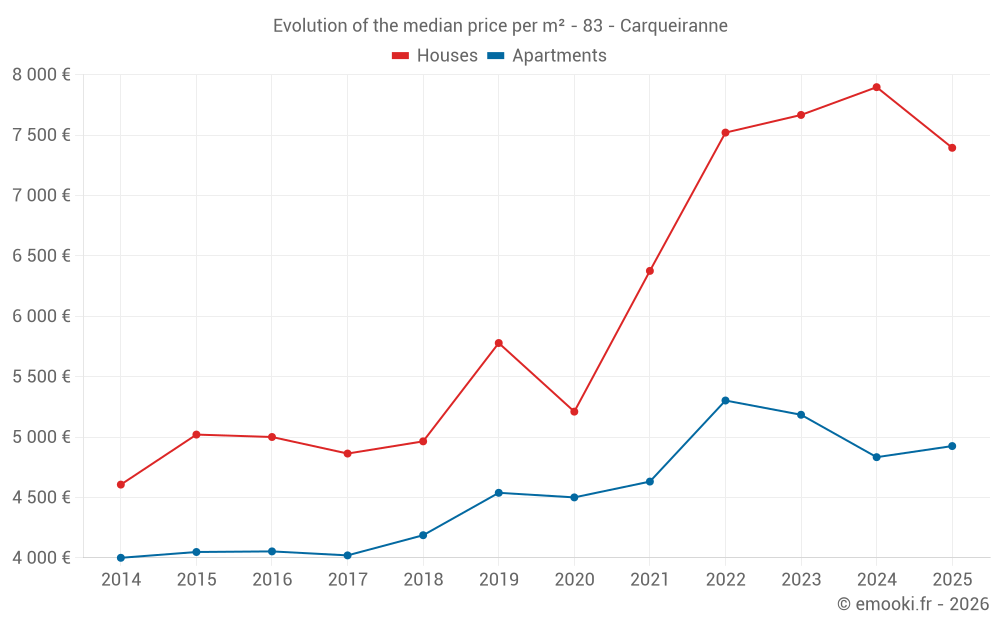
Median price of real estate
in the municipality of Carqueiranne

HousesHouses
7 394  /m²
1-23-45-67-89-10
Reliability 9/10
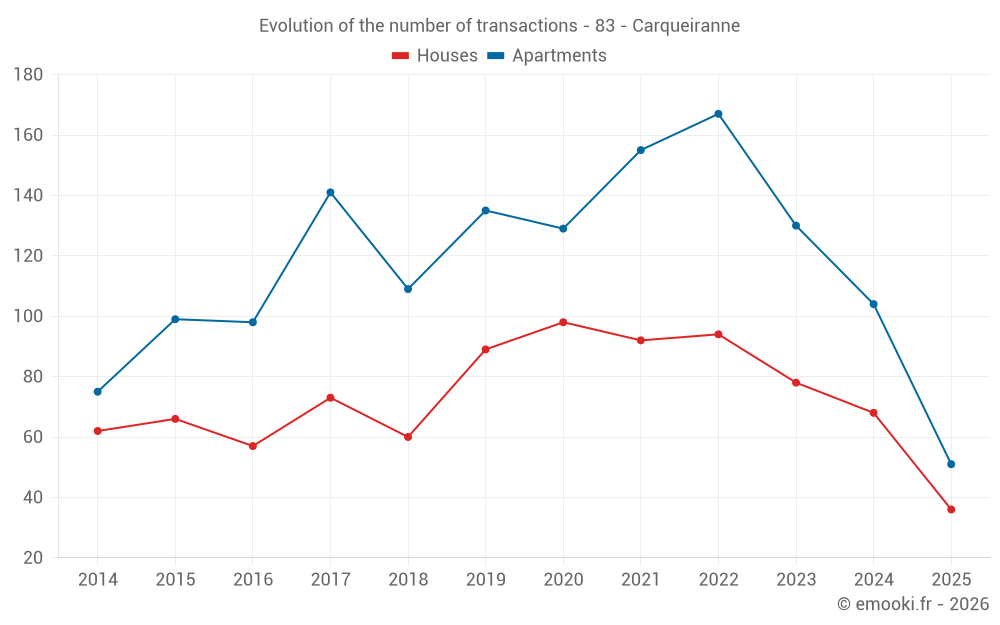
Median price on the 36 transactions of the last 6 months.
from 6 236 to
9 231  /m²
60% of transactions from the 2nd to the 8th deciles.
ApartmentsApartments
5 024  /m²
1-23-45-67-89-10
Reliability 10/10
Median price on the 24 transactions of the last 3 months.
from 3 891 to
5 726  /m²
60% of transactions from the 2nd to the 8th deciles.
DwellingsDwellings
5 385  /m²
1-23-45-67-89-10
Reliability 10/10
Median price on the 39 transactions of the last 3 months.
from 4 030 to
7 149  /m²
60% of transactions from the 2nd to the 8th deciles.
HousesEvolution of the price per m² of houses since...
1 year
-6.4%
2 years
-3.5%
3 years
-1.7%
4 years
+16%
5 years
+42%
6 years
+28%
7 years
+49%
8 years
+52%
9 years
+48%
10 years
+47%
11 years
+61%
The price per m² of houses has decreased by 6.4% since 1 year, but it has increased by 61% in 11 years.
ApartmentsEvolution of the price per m² of apartments since...
1 year
+1.9%
2 years
-5%
3 years
-7.1%
4 years
+6.3%
5 years
+9.4%
6 years
+8.5%
7 years
+18%
8 years
+23%
9 years
+22%
10 years
+22%
11 years
+23%
The price per m² of apartments has decreased by 7.1% since 3 years, but it has increased by 23% in 11 years.

Yearly evolution

Evolution of the median price per m²

Evolution of the median price per m² - 83 - Carqueiranne

Evolution of the number of transactions

Warning, last year incomplete. Projections made based on the proportions between semesters of the previous year at the departmental/national level and by type of property.

Evolution of the number of transactions - 83 - Carqueiranne

Yearly data

Descending order
Year
Houses
house
transactions
Houses
house
Price per m²
Apartments
apt.
transactions
Apartments
apt.
Price per m²
2025
36
7 394 
51
4 925 
2024
68
7 896 
104
4 833 
2023
78
7 666 
130
5 184 
2022
94
7 520 
167
5 302 
2021
92
6 375 
155
4 631 
2020
98
5 210 
129
4 500 
2019
89
5 778 
135
4 538 
2018
60
4 964 
109
4 187 
2017
73
4 863 
141
4 020 
2016
57
5 000 
98
4 053 
2015
66
5 020 
99
4 048 
2014
62
4 606 
75
4 000 

Analysis

Structure of prices per m²

Values of price percentiles per m² over the periods used for the estimated price of each type of property.

Structure of transaction amounts

Values of transaction amounts percentiles over the periods used for the estimated price of each type of property.

Transaction amounts and prices per m² by percentile

Ascending order
Percentile
Houses
house
Price per m²
Houses
house
Transaction amount
Apartments
apt.
Price per m²
Apartments
apt.
Transaction amount
10th percentile
4 976 
465 K
3 805 
146 K
20th percentile
6 236 
560 K
3 891 
164 K
30th percentile
6 602 
668 K
4 043 
210 K
40th percentile
7 118 
760 K
4 719 
247 K
50th percentile
7 394 
790 K
5 024 
281 K
60th percentile
7 671 
910 K
5 254 
300 K
70th percentile
8 196 
1 170 K
5 486 
329 K
80th percentile
9 231 
1 250 K
5 726 
365 K
90th percentile
11 099 
1 301 K
6 015 
374 K

National and departmental comparison

Evolution of the median price per m² of houses

Evolution of the median price per m² of apartments

Quarterly evolution

Evolution of the median price per m²

Evolution of the number of transactions

Quarterly data

Descending order
Quarter
Houses
house
transactions
Houses
house
Price per m²
Apartments
apt.
transactions
Apartments
apt.
Price per m²
2025 Q2
15
7 118 
24
5 024 
2025 Q1
21
7 476 
27
4 925 
2024 Q4
14
7 288 
31
4 845 
2024 Q3
21
8 305 
31
5 206 
2024 Q2
21
7 401 
30
4 620 
2024 Q1
12
8 666 
12
4 564 
2023 Q4
18
6 972 
25
4 912 
2023 Q3
19
6 962 
38
5 374 
2023 Q2
21
8 657 
30
5 138 
2023 Q1
20
6 918 
37
5 200 
2022 Q4
19
7 977 
34
5 435 
2022 Q3
22
7 344 
50
5 019 
2022 Q2
25
7 566 
44
4 966 
2022 Q1
28
7 209 
39
5 602 
2021 Q4
24
6 464 
37
4 739 
2021 Q3
15
7 823 
48
4 629 
2021 Q2
30
6 518 
29
4 969 
2021 Q1
23
5 658 
41
4 375 
2020 Q4
32
5 166 
40
4 571 
2020 Q3
20
5 714 
32
4 706 
2020 Q2
21
5 179 
22
4 437 
2020 Q1
25
4 978 
35
4 215 
2019 Q4
29
5 833 
42
4 587 
2019 Q3
25
5 909 
39
4 711 
2019 Q2
18
6 096 
36
4 066 
2019 Q1
17
5 130 
18
4 690 
2018 Q4
19
4 819 
28
4 476 
2018 Q3
15
5 229 
28
3 960 
2018 Q2
16
6 244 
25
4 389 
2018 Q1
10
4 203 
28
4 326 
2017 Q4
12
4 512 
34
4 136 
2017 Q3
17
5 027 
28
4 288 
2017 Q2
23
5 075 
47
3 791 
2017 Q1
21
4 466 
32
4 524 
2016 Q4
16
4 870 
28
3 684 
2016 Q3
20
5 069 
27
4 400 
2016 Q2
7
4 211 
23
3 781 
2016 Q1
14
5 369 
20
4 298 
2015 Q4
19
4 857 
30
4 014 
2015 Q3
16
5 996 
33
4 490 
2015 Q2
11
5 000 
25
4 170 
2015 Q1
20
5 015 
11
3 272 
2014 Q4
11
4 480 
22
4 516 
2014 Q3
21
4 652 
16
3 793 
2014 Q2
15
5 040 
21
3 880 
2014 Q1
15
4 051 
16
3 511 

Overview of the latest real estate transactions

The following list is an anonymized overview of the latest transactions. For more details and to find all transactions, please use the map to view transactions by plot or the transaction search page for a search by criteria.

2025-06-30
1 342 000 
11 772  /m²(114 m²)
Sale
Houses
House
6 rooms
114 m2
1 outbuilding
Land
633 m2
-Sols
Land
704 m2
-Terrains à bâtir
2025-06-27
606 000 
8 535  /m²(71 m²)
Sale
Houses
House
3 rooms
71 m2
2025-06-25
216 880 
4 171  /m²(52 m²)
Sale
Apartments
Apartment
2 rooms
52 m2
3 outbuildings
2025-06-23
370 000 
5 211  /m²(71 m²)
Sale
Apartments
Apartment
3 rooms
71 m2
4 outbuildings
2025-06-19
385 500 
8 567  /m²(45 m²)
Sale
Apartments
Apartment
2 rooms
45 m2
1 outbuilding
2025-06-12
440 000 
Sale
Land
1000 m2
-Terrains à bâtir
2025-06-05
9 800 
Sale
Land
300 m2
-Terres
Land
249 m2
-Landes
Land
15 m2
-Landes
Land
21 m2
-Landes
Land
33 m2
-Sols
Land
29 m2
-Terres
2025-06-02
128 000 
5 818  /m²(22 m²)
Sale
Apartments
Apartment
1 room
22 m2
1 outbuilding
1 outbuilding
2025-05-28
27 000 
Sale
1 outbuilding
2025-05-28
182 000 
5 515  /m²(33 m²)
Sale
Apartments
Apartment
1 room
33 m2
2025-05-27
1 500 
Sale
Land
307 m2
-Jardins
/Pré marais
Land
86 m2
-Jardins
/Pré marais
2025-05-27
281 000 
3 797  /m²(74 m²)
Sale
Apartments
Apartment
5 rooms
74 m2
2025-05-23
260 000 
3 824  /m²(68 m²)
Sale
Apartments
Apartment
4 rooms
68 m2
2 outbuildings
2025-05-22
500 000 
4 545  /m²(110 m²)
Sale
Houses
House
5 rooms
110 m2
2025-05-22
303 200 
3 369  /m²(90 m²)
Sale
Apartments
Apartment
4 rooms
90 m2
2025-05-22
1 200 000 
6 522  /m²(184 m²)
Sale
Houses
House
8 rooms
184 m2
2 outbuildings
Land
980 m2
-Sols
Land
11 m2
-Landes
2025-05-22
1 210 000 
7 118  /m²(170 m²)
Sale
Houses
House
7 rooms
170 m2
Land
1168 m2
-Sols
2025-05-21
1 252 400 
8 132  /m²(154 m²)
Sale
Houses
House
4 rooms
154 m2
1 outbuilding
Land
700 m2
-Sols
Land
1000 m2
-Terrains d'agrément
2025-05-20
375 000 
4 870  /m²(77 m²)
Sale
Apartments
Apartment
3 rooms
77 m2
2 outbuildings
2025-05-19
760 000 
10 411  /m²(73 m²)
Sale
Houses
House
3 rooms
73 m2
Land
500 m2
-Sols
Land
624 m2
-Terrains d'agrément
3027 transactions listed in the municipality

Var (83)

Most expensive cities

City
name
Descending orderHouses
house
Price per m²
29 062 
20 110 
9 205 
9 164 
7 834 
7 731 
7 394 
7 043 
7 014 
City
name
Descending orderApartments
apt.
Price per m²
12 692 
10 000 
7 656 
6 722 
6 667 
6 316 
6 264 
6 083 

Least expensive cities

City
name
Ascending orderHouses
house
Price per m²
1 250 
1 531 
1 825 
1 905 
1 925 
1 952 
1 998 
2 067 
2 083 
City
name
Ascending orderApartments
apt.
Price per m²
660 
738 
923 
950 
1 015 
1 033 
1 113 
1 229