emooki
HomePrice mapTransactions
🇬🇧 English🇫🇷 Français🇩🇪 Deutsch🇪🇸 Español🇮🇹 Italiano

Real estate price map


Real estate price map in the municipality of Ramatuelle.

Var (83)
Ramatuelle

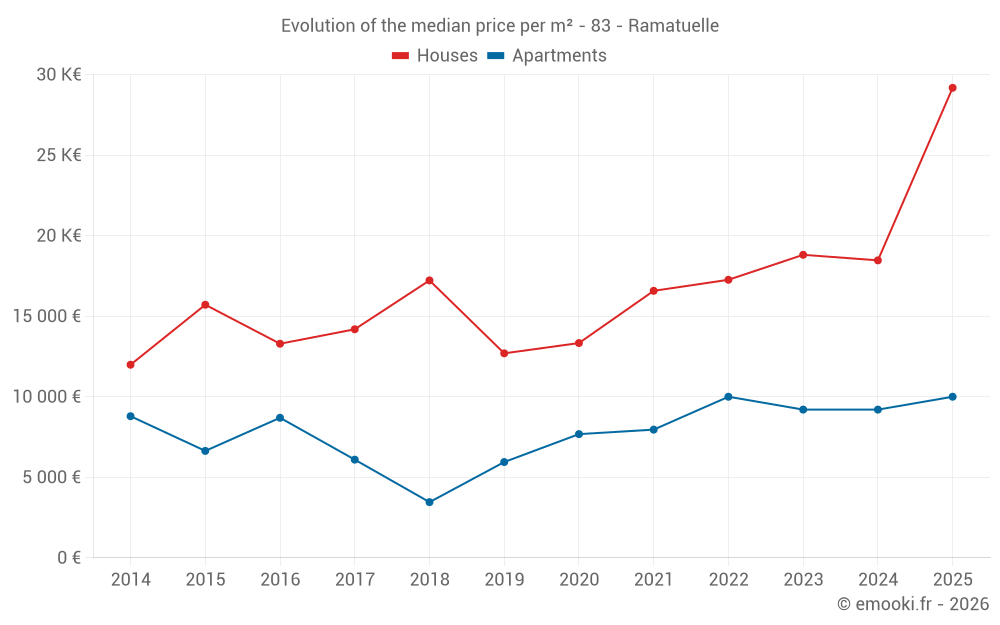
Median price of real estate
in the municipality of Ramatuelle

HousesHouses
20 110 € /m²
1-23-45-67-89-10
Reliability 8/10
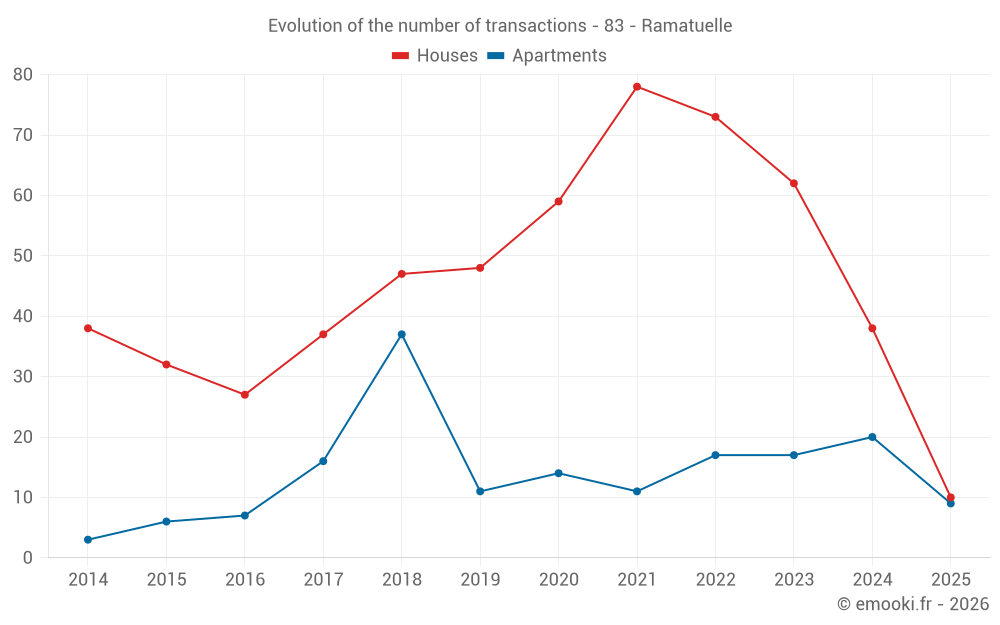
Median price on the 34 transactions of the last 12 months.
from 12 701 to
29 727 € /m²
60% of transactions from the 2nd to the 8th deciles.
ApartmentsApartments
10 000 € /m²
1-23-45-67-89-10
Reliability 8/10
Median price on the 21 transactions of the last 12 months.
from 6 061 to
15 385 € /m²
60% of transactions from the 2nd to the 8th deciles.
DwellingsDwellings
11 200 € /m²
1-23-45-67-89-10
Reliability 9/10
Median price on the 19 transactions of the last 6 months.
from 7 478 to
30 121 € /m²
60% of transactions from the 2nd to the 8th deciles.
HousesEvolution of the price per m² of houses since...
1 year
+58%
2 years
+55%
3 years
+69%
4 years
+76%
5 years
+119%
6 years
+130%
7 years
+69%
8 years
+106%
9 years
+120%
10 years
+86%
11 years
+143%
ApartmentsEvolution of the price per m² of apartments since...
1 year
+8.7%
2 years
+8.7%
3 years
0%
4 years
+26%
5 years
+30%
6 years
+68%
7 years
+189%
8 years
+64%
9 years
+15%
10 years
+51%
11 years
--

Yearly evolution

Evolution of the median price per m²

Evolution of the number of transactions

Warning, last year incomplete. Projections made based on the proportions between semesters of the previous year at the departmental/national level and by type of property.

Yearly data

Descending order
Year
Houses
house
transactions
Houses
house
Price per m²
Apartments
apt.
transactions
Apartments
apt.
Price per m²
2025
10
29 179 €
9
10 000 €
2024
38
18 467 €
20
9 200 €
2023
62
18 811 €
17
9 200 €
2022
73
17 261 €
17
10 000 €
2021
78
16 576 €
11
7 958 €
2020
59
13 333 €
14
7 679 €
2019
48
12 695 €
11
5 946 €
2018
47
17 222 €
37
3 456 €
2017
37
14 189 €
16
6 094 €
2016
27
13 291 €
7
8 694 €
2015
32
15 710 €
6
6 636 €
2014
38
11 988 €
3
8 791 €

Analysis

Structure of prices per m²

Values of price percentiles per m² over the periods used for the estimated price of each type of property.

Structure of transaction amounts

Values of transaction amounts percentiles over the periods used for the estimated price of each type of property.

Transaction amounts and prices per m² by percentile

Ascending order
Percentile
Houses
house
Price per m²
Houses
house
Transaction amount
Apartments
apt.
Price per m²
Apartments
apt.
Transaction amount
10th percentile
9 928 €
680 K€
4 943 €
200 K€
20th percentile
12 701 €
1 128 K€
6 061 €
400 K€
30th percentile
14 189 €
1 683 K€
8 108 €
421 K€
40th percentile
16 875 €
2 478 K€
8 955 €
460 K€
50th percentile
20 110 €
2 935 K€
10 000 €
600 K€
60th percentile
22 853 €
3 874 K€
10 739 €
730 K€
70th percentile
28 366 €
6 140 K€
12 500 €
1 020 K€
80th percentile
29 727 €
7 501 K€
15 385 €
1 100 K€
90th percentile
53 052 €
9 790 K€
17 750 €
2 363 K€

National and departmental comparison

Evolution of the median price per m² of houses

Evolution of the median price per m² of apartments

Quarterly evolution

Evolution of the median price per m²

Evolution of the number of transactions

Quarterly data

Descending order
Quarter
Houses
house
transactions
Houses
house
Price per m²
Apartments
apt.
transactions
Apartments
apt.
Price per m²
2025 Q2
6
25 612 €
4
7 830 €
2025 Q1
4
41 816 €
5
10 145 €
2024 Q4
15
17 105 €
6
6 554 €
2024 Q3
9
14 261 €
6
15 125 €
2024 Q2
8
16 944 €
4
7 247 €
2024 Q1
6
19 789 €
4
11 846 €
2023 Q4
13
18 033 €
2
3 958 €
2023 Q3
12
21 356 €
8
10 730 €
2023 Q2
19
21 318 €
4
9 018 €
2023 Q1
18
16 178 €
3
9 200 €
2022 Q4
17
17 261 €
4
10 895 €
2022 Q3
15
16 476 €
3
8 261 €
2022 Q2
22
21 500 €
8
10 193 €
2022 Q1
19
16 429 €
2
10 080 €
2021 Q4
23
16 808 €
7
7 958 €
2021 Q3
26
16 368 €
0
--- €
2021 Q2
15
16 630 €
2
10 928 €
2021 Q1
14
17 788 €
2
7 209 €
2020 Q4
20
14 218 €
5
15 238 €
2020 Q3
17
11 900 €
2
10 068 €
2020 Q2
12
15 675 €
5
4 672 €
2020 Q1
10
14 504 €
2
12 500 €
2019 Q4
15
13 846 €
3
4 184 €
2019 Q3
13
10 410 €
8
6 340 €
2019 Q2
7
10 571 €
0
--- €
2019 Q1
13
13 750 €
0
--- €
2018 Q4
13
16 563 €
9
5 333 €
2018 Q3
11
19 628 €
6
5 132 €
2018 Q2
13
16 801 €
17
3 298 €
2018 Q1
10
19 278 €
5
3 345 €
2017 Q4
12
13 304 €
0
--- €
2017 Q3
8
13 261 €
6
4 898 €
2017 Q2
9
17 986 €
6
6 256 €
2017 Q1
8
16 226 €
4
8 010 €
2016 Q4
9
10 025 €
2
8 229 €
2016 Q3
11
13 929 €
0
--- €
2016 Q2
3
16 060 €
3
8 694 €
2016 Q1
4
8 024 €
2
9 002 €
2015 Q4
6
16 390 €
3
8 155 €
2015 Q3
11
15 283 €
1
3 922 €
2015 Q2
9
21 395 €
0
--- €
2015 Q1
6
6 445 €
2
11 493 €
2014 Q4
9
12 000 €
0
--- €
2014 Q3
11
7 800 €
2
7 668 €
2014 Q2
7
16 385 €
0
--- €
2014 Q1
11
11 736 €
1
8 791 €

Var (83)

Most expensive cities

City
name
Descending orderHouses
house
Price per m²
29 062 €
20 110 €
9 894 €
9 205 €
9 164 €
7 834 €
7 731 €
7 394 €
7 043 €
7 014 €
City
name
Descending orderApartments
apt.
Price per m²
12 692 €
10 000 €
7 656 €
7 316 €
6 722 €
6 667 €
6 316 €
6 264 €
6 254 €
6 083 €

Least expensive cities

City
name
Ascending orderHouses
house
Price per m²
1 250 €
1 531 €
1 819 €
1 825 €
1 905 €
1 925 €
1 952 €
1 998 €
2 067 €
2 083 €
City
name
Ascending orderApartments
apt.
Price per m²
660 €
738 €
923 €
950 €
998 €
1 000 €
1 015 €
1 033 €
1 113 €
1 229 €