emooki
SearchPrice mapTransactions
🇬🇧 English🇫🇷 Français🇩🇪 Deutsch🇪🇸 Español🇮🇹 Italiano

Real estate price map


Real estate price map in the municipality of Bormes-les-Mimosas.

Var (83)
Bormes-les-Mimosas

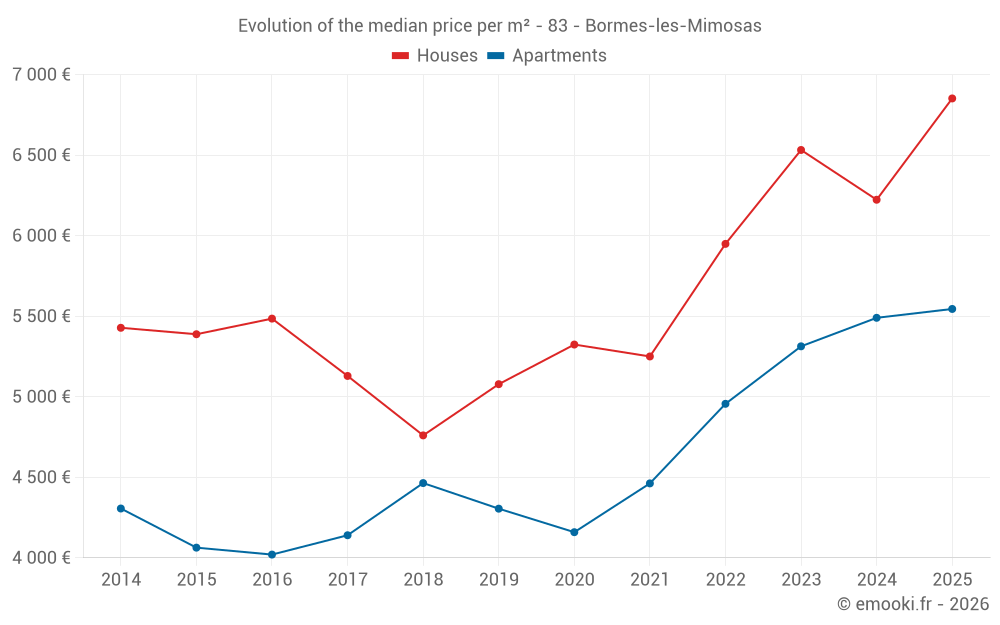
Median price of real estate
in the municipality of Bormes-les-Mimosas

HousesHouses
6 442 € /m²
1-23-45-67-89-10
Reliability 10/10
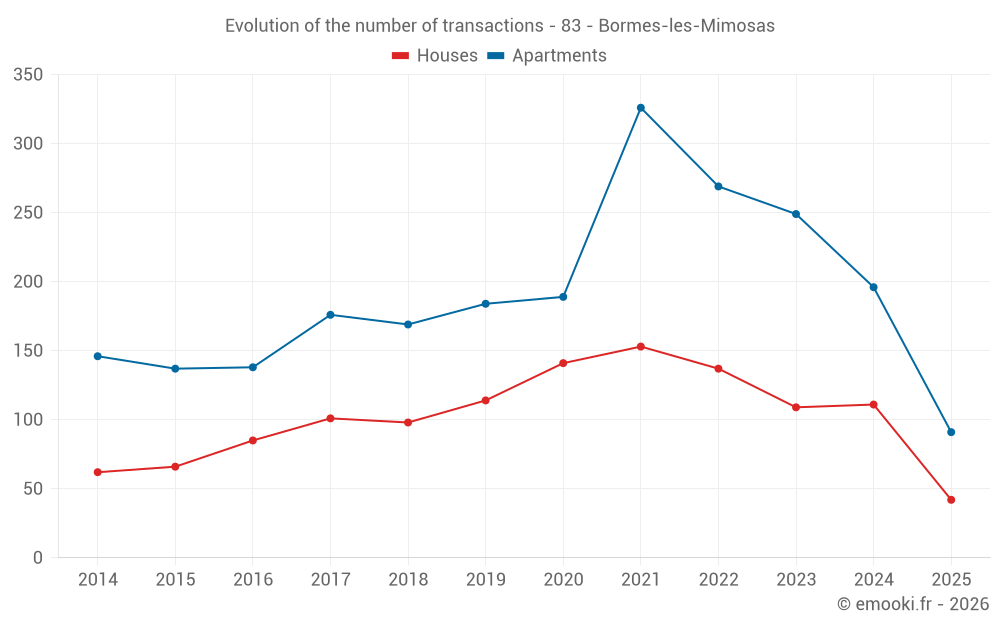
Median price on the 21 transactions of the last 3 months.
from 5 294 to
11 857 € /m²
60% of transactions from the 2nd to the 8th deciles.
ApartmentsApartments
5 640 € /m²
1-23-45-67-89-10
Reliability 10/10
Median price on the 48 transactions of the last 3 months.
from 4 627 to
6 449 € /m²
60% of transactions from the 2nd to the 8th deciles.
DwellingsDwellings
5 768 € /m²
1-23-45-67-89-10
Reliability 10/10
Median price on the 69 transactions of the last 3 months.
from 4 712 to
6 943 € /m²
60% of transactions from the 2nd to the 8th deciles.
HousesEvolution of the price per m² of houses
1 year
+10.1%
2 years
+4.9%
3 years
+15.2%
4 years
+30.5%
5 years
+28.7%
6 years
+34.9%
7 years
+43.9%
8 years
+33.6%
9 years
+24.9%
10 years
+27.2%
11 years
+26.2%
ApartmentsEvolution of the price per m² of apartments
1 year
+1%
2 years
+4.4%
3 years
+11.9%
4 years
+24.3%
5 years
+33.3%
6 years
+28.8%
7 years
+24.2%
8 years
+33.9%
9 years
+37.9%
10 years
+36.5%
11 years
+28.8%

Yearly evolution

Median price per m²

Number of transactions

Warning, last year incomplete. Projections made based on the proportions between semesters of the previous year at the departmental/national level and by type of property.

Yearly data

Descending order
Year
Houses
house
Price per m²
Houses
house
transactions
Apartments
apt.
Price per m²
Apartments
apt.
transactions
2025
6 852 €
42
5 545 €
91
2024
6 223 €
111
5 490 €
196
2023
6 532 €
109
5 313 €
249
2022
5 949 €
137
4 956 €
269
2021
5 250 €
153
4 462 €
326
2020
5 324 €
141
4 159 €
189
2019
5 078 €
114
4 305 €
184
2018
4 760 €
98
4 464 €
169
2017
5 129 €
101
4 140 €
176
2016
5 485 €
85
4 020 €
138
2015
5 388 €
66
4 063 €
137
2014
5 428 €
62
4 306 €
146

Quarterly evolution

Median price per m²

Number of transactions

Analysis

Structure of prices per m²

Values of price percentiles per m² over the periods used for the estimated price of each type of property.

Var (83)

Most expensive cities

City
name
Descending orderHouses
house
Price per m²
29 062 €
20 110 €
9 894 €
9 205 €
9 164 €
7 834 €
7 731 €
7 394 €
7 043 €
7 014 €
City
name
Descending orderApartments
apt.
Price per m²
12 692 €
10 000 €
7 656 €
7 316 €
6 722 €
6 667 €
6 316 €
6 264 €
6 254 €
6 083 €

Least expensive cities

City
name
Ascending orderHouses
house
Price per m²
1 250 €
1 531 €
1 819 €
1 825 €
1 905 €
1 925 €
1 952 €
1 998 €
2 067 €
2 083 €
City
name
Ascending orderApartments
apt.
Price per m²
660 €
738 €
923 €
950 €
998 €
1 000 €
1 015 €
1 033 €
1 113 €
1 229 €