emooki
HomePrice mapTransactions
🇬🇧 English🇫🇷 Français🇩🇪 Deutsch🇪🇸 Español🇮🇹 Italiano

Real estate price map


Real estate price map in the municipality of Montévrain.

Seine-et-Marne (77)
Montévrain

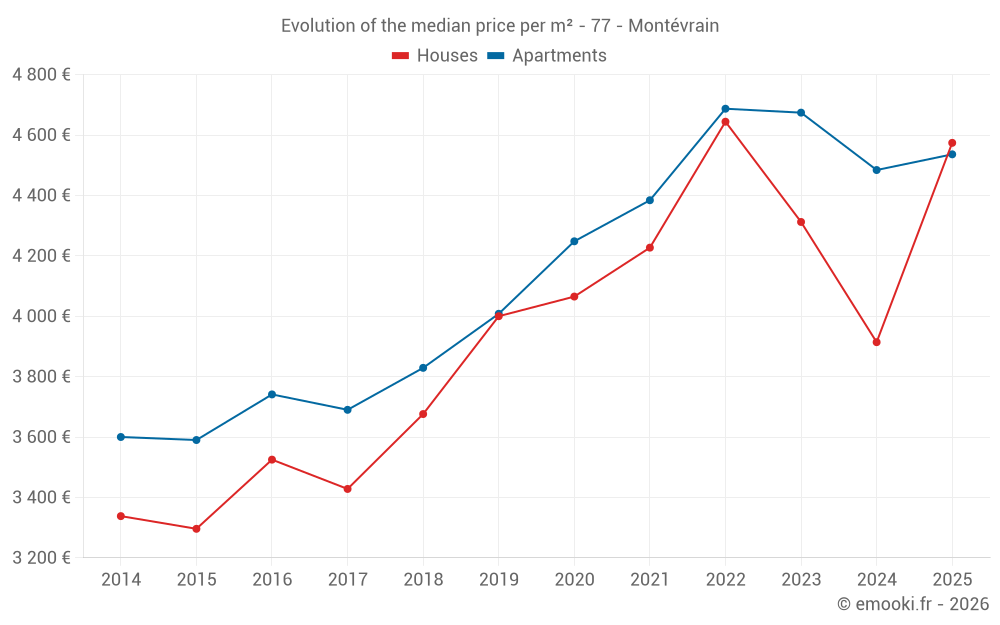
Median price of real estate
in the municipality of Montévrain

HousesHouses
3 921  /m²
1-23-45-67-89-10
Reliability 8/10
Median price on the 30 transactions of the last 12 months.
from 3 184 to
4 869  /m²
60% of transactions from the 2nd to the 8th deciles.
ApartmentsApartments
4 800  /m²
1-23-45-67-89-10
Reliability 10/10
Median price on the 23 transactions of the last 3 months.
from 3 606 to
5 849  /m²
60% of transactions from the 2nd to the 8th deciles.
DwellingsDwellings
4 800  /m²
1-23-45-67-89-10
Reliability 10/10
Median price on the 27 transactions of the last 3 months.
from 3 536 to
5 806  /m²
60% of transactions from the 2nd to the 8th deciles.
HousesEvolution of the price per m² of houses since...
1 year
+17%
2 years
+6.1%
3 years
-1.5%
4 years
+8.2%
5 years
+13%
6 years
+14%
7 years
+24%
8 years
+33%
9 years
+30%
10 years
+39%
11 years
+37%
ApartmentsEvolution of the price per m² of apartments since...
1 year
+1.2%
2 years
-3%
3 years
-3.2%
4 years
+3.5%
5 years
+6.8%
6 years
+13%
7 years
+18%
8 years
+23%
9 years
+21%
10 years
+26%
11 years
+26%

Yearly evolution

Evolution of the median price per m²

Evolution of the number of transactions

Warning, last year incomplete. Projections made based on the proportions between semesters of the previous year at the departmental/national level and by type of property.

Yearly data

Descending order
Year
Houses
house
transactions
Houses
house
Price per m²
Apartments
apt.
transactions
Apartments
apt.
Price per m²
2025
12
4 574 
66
4 536 
2024
35
3 914 
139
4 484 
2023
38
4 312 
164
4 674 
2022
62
4 644 
231
4 687 
2021
57
4 227 
220
4 384 
2020
51
4 065 
216
4 248 
2019
61
4 000 
222
4 008 
2018
46
3 676 
217
3 829 
2017
58
3 428 
257
3 690 
2016
41
3 525 
153
3 741 
2015
48
3 296 
114
3 590 
2014
46
3 338 
82
3 600 

Analysis

Structure of prices per m²

Values of price percentiles per m² over the periods used for the estimated price of each type of property.

Structure of transaction amounts

Values of transaction amounts percentiles over the periods used for the estimated price of each type of property.

Transaction amounts and prices per m² by percentile

Ascending order
Percentile
Houses
house
Price per m²
Houses
house
Transaction amount
Apartments
apt.
Price per m²
Apartments
apt.
Transaction amount
10th percentile
2 108 
284 K
3 426 
128 K
20th percentile
3 184 
320 K
3 606 
130 K
30th percentile
3 599 
346 K
3 944 
139 K
40th percentile
3 819 
388 K
4 151 
152 K
50th percentile
3 921 
402 K
4 800 
170 K
60th percentile
4 529 
438 K
5 090 
189 K
70th percentile
4 628 
468 K
5 722 
214 K
80th percentile
4 869 
482 K
5 849 
242 K
90th percentile
5 258 
557 K
6 032 
279 K

National and departmental comparison

Evolution of the median price per m² of houses

Evolution of the median price per m² of apartments

Quarterly evolution

Evolution of the median price per m²

Evolution of the number of transactions

Quarterly data

Descending order
Quarter
Houses
house
transactions
Houses
house
Price per m²
Apartments
apt.
transactions
Apartments
apt.
Price per m²
2025 Q2
4
4 442 
23
4 800 
2025 Q1
8
4 574 
43
4 516 
2024 Q4
9
3 852 
32
4 522 
2024 Q3
9
3 950 
33
4 306 
2024 Q2
7
4 279 
37
4 542 
2024 Q1
10
3 981 
37
4 750 
2023 Q4
12
4 570 
33
4 591 
2023 Q3
11
4 234 
40
4 572 
2023 Q2
10
4 222 
49
4 788 
2023 Q1
5
4 390 
42
4 735 
2022 Q4
7
5 021 
51
4 697 
2022 Q3
28
4 748 
52
4 639 
2022 Q2
16
4 531 
68
4 672 
2022 Q1
11
4 533 
60
4 722 
2021 Q4
10
4 450 
49
4 444 
2021 Q3
27
4 388 
72
4 346 
2021 Q2
11
4 130 
49
4 356 
2021 Q1
9
4 588 
50
4 461 
2020 Q4
14
4 316 
60
4 504 
2020 Q3
14
4 026 
57
4 227 
2020 Q2
10
3 820 
47
4 212 
2020 Q1
13
4 295 
52
4 128 
2019 Q4
15
4 422 
56
4 064 
2019 Q3
19
4 103 
55
4 093 
2019 Q2
17
3 871 
51
4 000 
2019 Q1
10
3 792 
60
3 944 
2018 Q4
13
3 600 
49
3 862 
2018 Q3
13
3 746 
59
3 818 
2018 Q2
12
3 562 
53
3 818 
2018 Q1
8
3 700 
56
3 841 
2017 Q4
10
3 930 
68
3 616 
2017 Q3
13
3 377 
66
3 664 
2017 Q2
14
3 400 
69
3 636 
2017 Q1
21
3 175 
54
3 818 
2016 Q4
5
3 000 
40
3 812 
2016 Q3
20
3 662 
59
3 727 
2016 Q2
9
2 953 
29
3 822 
2016 Q1
7
2 958 
25
3 683 
2015 Q4
8
3 680 
34
3 703 
2015 Q3
18
3 120 
37
3 500 
2015 Q2
11
3 121 
26
3 533 
2015 Q1
11
3 538 
17
3 625 
2014 Q4
14
3 422 
28
3 543 
2014 Q3
17
3 458 
21
3 729 
2014 Q2
7
3 248 
14
3 617 
2014 Q1
8
2 306 
19
3 635 

Seine-et-Marne (77)

Most expensive cities

City
name
Descending orderHouses
house
Price per m²
5 573 
4 928 
4 680 
4 436 
4 277 
4 214 
4 098 
City
name
Descending orderApartments
apt.
Price per m²
64 397 
10 818 
4 800 
4 625 
4 584 
4 574 
4 430 

Least expensive cities

City
name
Ascending orderHouses
house
Price per m²
1 052 
1 280 
1 330 
1 338 
1 341 
1 406 
City
name
Ascending orderApartments
apt.
Price per m²
580 
675 
682