emooki
HomePrice mapTransactions
🇬🇧 English🇫🇷 Français🇩🇪 Deutsch🇪🇸 Español🇮🇹 Italiano

Real estate price map


Real estate price map in the municipality of Chalifert, choose a section to see transactions by parcel.

Seine-et-Marne (77)

Chalifert - Real estate price m²

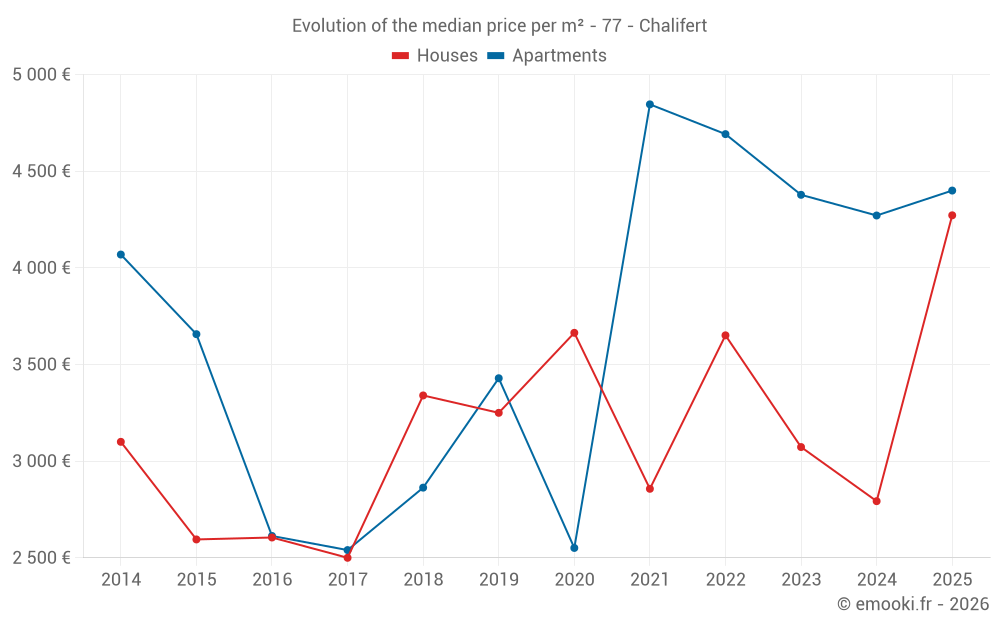
Median price of real estate
in the municipality of Chalifert

HousesHouses
3 278  /m²
1-23-45-67-89-10
Reliability 7/10
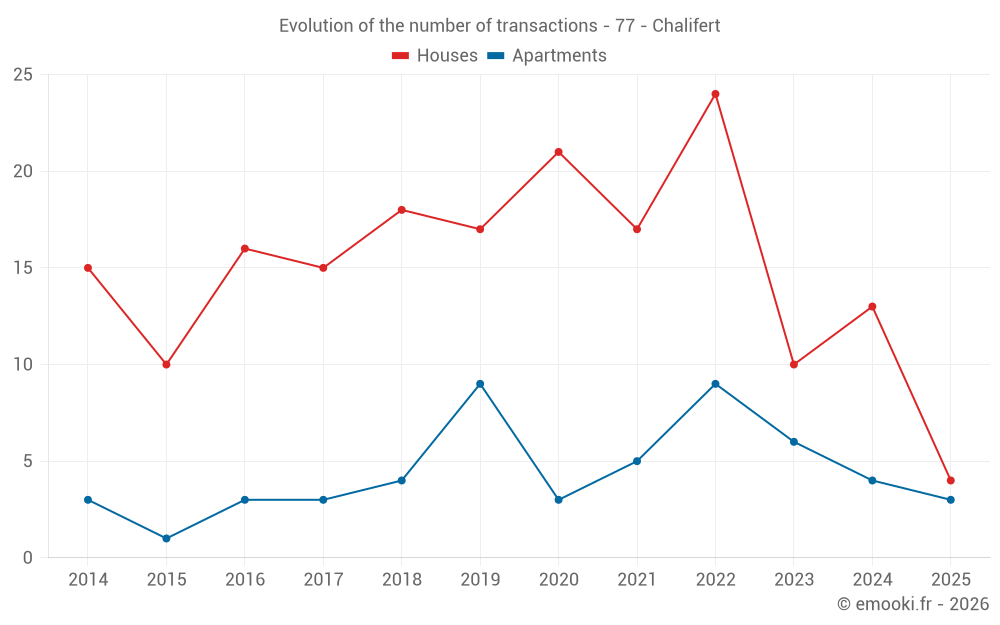
Median price on the 21 transactions of the last 24 months.
from 2 247 to
4 144  /m²
60% of transactions from the 2nd to the 8th deciles.
ApartmentsApartments
4 400  /m²
1-23-45-67-89-10
Reliability 6/10
Median price on the 19 transactions of the last 36 months.
from 4 248 to
4 764  /m²
60% of transactions from the 2nd to the 8th deciles.
DwellingsDwellings
3 438  /m²
1-23-45-67-89-10
Reliability 8/10
Median price on the 16 transactions of the last 12 months.
from 2 300 to
4 400  /m²
60% of transactions from the 2nd to the 8th deciles.
HousesEvolution of the price per m² of houses since...
1 year
+53%
2 years
+39%
3 years
+17%
4 years
+50%
5 years
+17%
6 years
+31%
7 years
+28%
8 years
+71%
9 years
+64%
10 years
+65%
11 years
+38%

Yearly evolution

Evolution of the median price per m²

Evolution of the median price per m² - 77 - Chalifert

Evolution of the number of transactions

Warning, last year incomplete. Projections made based on the proportions between semesters of the previous year at the departmental/national level and by type of property.

Evolution of the number of transactions - 77 - Chalifert

Yearly data

Descending order
Year
Houses
house
transactions
Houses
house
Price per m²
Apartments
apt.
transactions
Apartments
apt.
Price per m²
2025
4
4 272 
3
4 400 
2024
13
2 793 
4
4 271 
2023
10
3 073 
6
4 378 
2022
24
3 651 
9
4 692 
2021
17
2 857 
5
4 846 
2020
21
3 664 
3
2 551 
2019
17
3 250 
9
3 429 
2018
18
3 340 
4
2 863 
2017
15
2 500 
3
2 540 
2016
16
2 605 
3
2 613 
2015
10
2 595 
1
3 657 
2014
15
3 100 
3
4 069 

Analysis

Structure of prices per m²

Values of price percentiles per m² over the periods used for the estimated price of each type of property.

Structure of transaction amounts

Values of transaction amounts percentiles over the periods used for the estimated price of each type of property.

Transaction amounts and prices per m² by percentile

Ascending order
Percentile
Houses
house
Price per m²
Houses
house
Transaction amount
Apartments
apt.
Price per m²
Apartments
apt.
Transaction amount
10th percentile
1 625 
130 K
4 111 
135 K
20th percentile
2 247 
161 K
4 248 
148 K
30th percentile
2 345 
280 K
4 324 
156 K
40th percentile
2 793 
313 K
4 355 
164 K
50th percentile
3 278 
360 K
4 400 
183 K
60th percentile
3 456 
385 K
4 541 
195 K
70th percentile
4 051 
429 K
4 680 
205 K
80th percentile
4 144 
449 K
4 764 
212 K
90th percentile
4 375 
530 K
4 876 
295 K

National and departmental comparison

Evolution of the median price per m² of houses

Evolution of the median price per m² of apartments

Quarterly evolution

Evolution of the median price per m²

Evolution of the number of transactions

Quarterly data

Descending order
Quarter
Houses
house
transactions
Houses
house
Price per m²
Apartments
apt.
transactions
Apartments
apt.
Price per m²
2025 Q2
1
4 492 
1
4 886 
2025 Q1
3
4 051 
2
4 378 
2024 Q4
3
2 300 
0
--- 
2024 Q3
6
2 569 
0
--- 
2024 Q2
2
4 254 
3
4 356 
2024 Q1
2
3 037 
1
4 186 
2023 Q4
2
2 709 
1
4 795 
2023 Q3
2
2 934 
1
3 857 
2023 Q2
3
2 975 
0
--- 
2023 Q1
3
3 980 
4
4 378 
2022 Q4
7
2 966 
2
4 909 
2022 Q3
9
3 545 
4
4 678 
2022 Q2
2
5 280 
2
4 324 
2022 Q1
6
4 874 
1
5 500 
2021 Q4
4
3 300 
1
4 022 
2021 Q3
3
2 938 
2
5 178 
2021 Q2
6
2 614 
2
5 192 
2021 Q1
4
4 423 
0
--- 
2020 Q4
7
4 090 
1
2 239 
2020 Q3
6
3 207 
0
--- 
2020 Q2
5
3 469 
0
--- 
2020 Q1
3
3 664 
2
3 276 
2019 Q4
5
3 383 
1
4 286 
2019 Q3
2
4 338 
0
--- 
2019 Q2
6
3 216 
3
2 786 
2019 Q1
4
3 284 
5
3 429 
2018 Q4
8
4 214 
3
3 083 
2018 Q3
2
2 512 
1
2 134 
2018 Q2
6
3 098 
0
--- 
2018 Q1
2
8 958 
0
--- 
2017 Q4
4
2 494 
0
--- 
2017 Q3
3
2 440 
1
2 042 
2017 Q2
5
2 239 
1
2 540 
2017 Q1
3
3 539 
1
3 114 
2016 Q4
1
3 745 
0
--- 
2016 Q3
8
2 827 
3
2 613 
2016 Q2
4
2 475 
0
--- 
2016 Q1
3
3 375 
0
--- 
2015 Q4
3
2 916 
0
--- 
2015 Q3
3
2 550 
0
--- 
2015 Q2
1
2 000 
0
--- 
2015 Q1
3
2 137 
1
3 657 
2014 Q4
4
2 806 
0
--- 
2014 Q3
7
3 103 
2
3 638 
2014 Q2
3
2 217 
0
--- 
2014 Q1
1
2 880 
1
4 154 

Overview of the latest real estate transactions

The following list is an anonymized overview of the latest transactions. For more details and to find all transactions, please use the map to view transactions by plot or the transaction search page for a search by criteria.

2025-06-20
215 000 
4 886  /m²(44 m²)
Sale
Apartments
Apartment
2 rooms
44 m2
1 outbuilding
2025-04-22
539 000 
4 492  /m²(120 m²)
Sale
Houses
House
4 rooms
120 m2
Land
312 m2
-Terrains d'agrément
/Parc
Land
500 m2
-Sols
2025-03-26
30 000 
Sale
Land
389 m2
-Sols
Land
197 m2
-Jardins
/Jardin potager
2025-03-26
250 000 
Sale
Land
313 m2
-Terrains à bâtir
2025-03-19
400 
Sale
Land
244 m2
-Taillis simples
Land
211 m2
-Taillis simples
2025-03-11
6 000 
Sale
Land
747 m2
-Taillis simples
2025-02-20
20 000 
Sale
Land
170 m2
-Sols
2025-02-17
285 190 
3 278  /m²(87 m²)
Sale
Houses
House
7 rooms
87 m2
1 outbuilding
Land
525 m2
-Sols
Land
21 m2
-Sols
2025-02-14
429 375 
4 771  /m²(90 m²)
Sale
Houses
House
4 rooms
90 m2
Land
556 m2
-Sols
Land
16 m2
-Sols
2025-02-14
1 172 880 
Sale
Land
8145 m2
-Terrains à bâtir
2025-02-12
7 600 
Sale
1 outbuilding
2025-02-03
1 636 
Sale
Land
126 m2
-Taillis simples
2025-01-31
154 000 
4 400  /m²(35 m²)
Sale
Apartments
Apartment
1 room
35 m2
2 outbuildings
2025-01-20
648 224 
4 051  /m²(160 m²)
Sale
Land
165 m2
-Jardins
/Jardin potager
Houses
House
5 rooms
160 m2
1 outbuilding
Land
500 m2
-Sols
Land
215 m2
-Jardins
/Jardin potager
Land
249 m2
-Jardins
/Jardin potager
Land
146 m2
-Taillis simples
Land
188 m2
-Taillis simples
Land
887 m2
-Taillis simples
2025-01-16
135 000 
4 355  /m²(31 m²)
Sale
Apartments
Apartment
1 room
31 m2
1 outbuilding
2025-01-10
8 900 
Sale
1 outbuilding
2024-12-27
8 000 
Sale
1 outbuilding
2024-12-27
446 998 
Sale
Land
3184 m2
-Terrains à bâtir
2024-12-02
449 000 
1 978  /m²(227 m²)
Sale
Houses
House
8 rooms
227 m2
Land
1115 m2
-Terrains d'agrément
/Parc
Land
500 m2
-Sols
2024-10-21
260 000 
Sale
Land
529 m2
-Terrains à bâtir
657 transactions listed in the municipality

Seine-et-Marne (77)

Most expensive cities

City
name
Descending orderHouses
house
Price per m²
5 573 
4 928 
4 680 
4 436 
4 277 
4 214 
4 098 
City
name
Descending orderApartments
apt.
Price per m²
64 397 
10 818 
4 800 
4 625 
4 584 
4 574 
4 430 

Least expensive cities

City
name
Ascending orderHouses
house
Price per m²
1 052 
1 280 
1 330 
1 338 
1 341 
1 406 
City
name
Ascending orderApartments
apt.
Price per m²
580 
675 
682