emooki
HomePrice mapTransactions
🇬🇧 English🇫🇷 Français🇩🇪 Deutsch🇪🇸 Español🇮🇹 Italiano

Real estate price map


Real estate price map in the municipality of Porte-de-Savoie, choose a section to see transactions by parcel.

Savoie (73)

Porte-de-Savoie - Real estate price m²

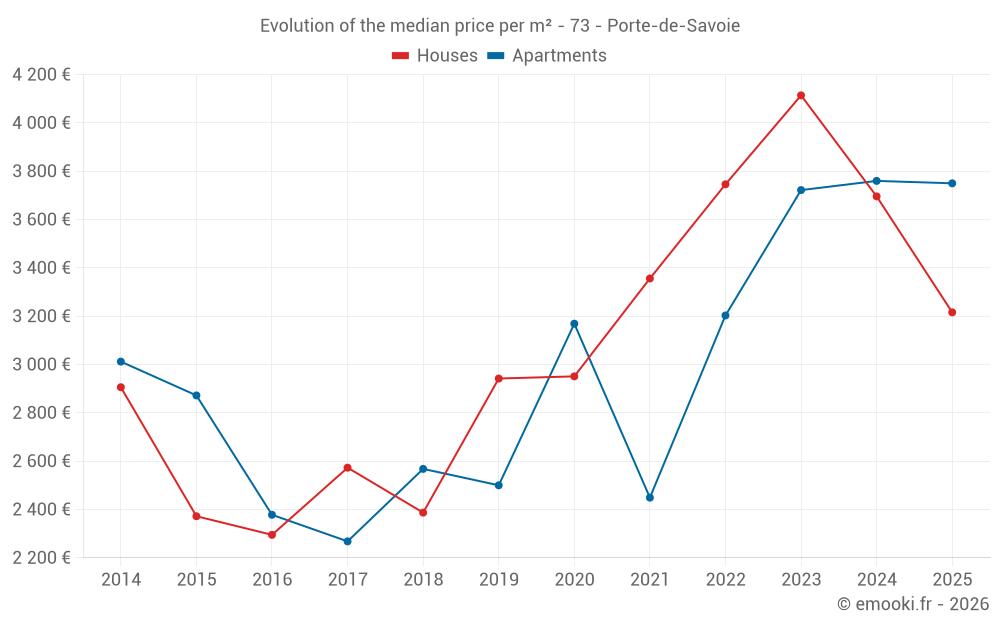
Median price of real estate
in the municipality of Porte-de-Savoie

HousesHouses
3 518  /m²
1-23-45-67-89-10
Reliability 8/10
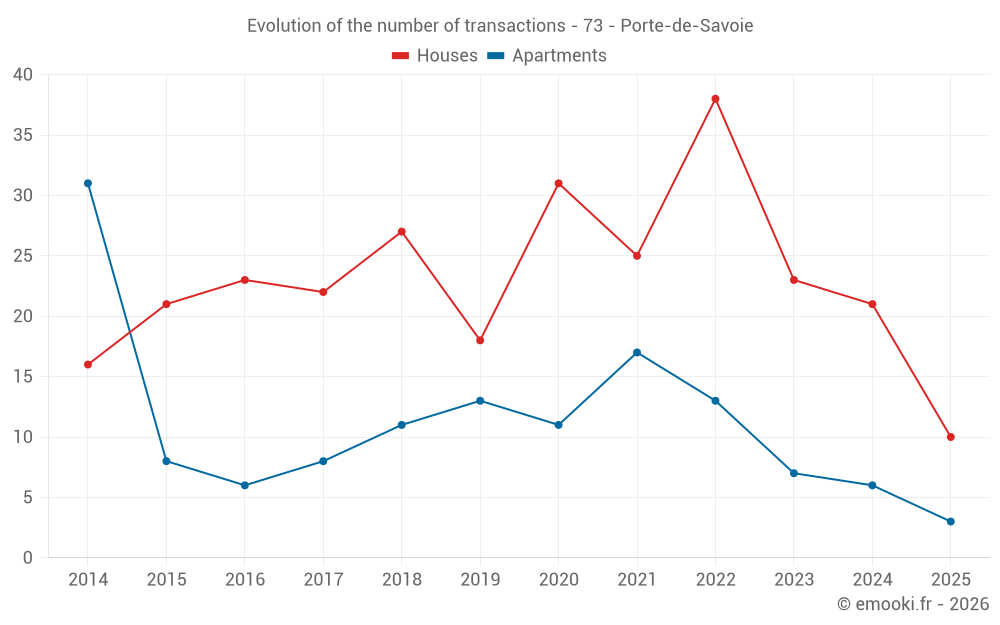
Median price on the 19 transactions of the last 12 months.
from 2 791 to
4 173  /m²
60% of transactions from the 2nd to the 8th deciles.
ApartmentsApartments
3 748  /m²
1-23-45-67-89-10
Reliability 6/10
Median price on the 23 transactions of the last 36 months.
from 2 740 to
3 878  /m²
60% of transactions from the 2nd to the 8th deciles.
DwellingsDwellings
3 666  /m²
1-23-45-67-89-10
Reliability 8/10
Median price on the 27 transactions of the last 12 months.
from 2 769 to
4 051  /m²
60% of transactions from the 2nd to the 8th deciles.
HousesEvolution of the price per m² of houses since...
1 year
-13%
2 years
-22%
3 years
-14%
4 years
-4.2%
5 years
+9%
6 years
+9.3%
7 years
+35%
8 years
+25%
9 years
+40%
10 years
+36%
11 years
+11%
The price per m² of houses has decreased by 22% since 2 years, but it has increased by 40% in 9 years.

Yearly evolution

Evolution of the median price per m²

Evolution of the median price per m² - 73 - Porte-de-Savoie

Evolution of the number of transactions

Warning, last year incomplete. Projections made based on the proportions between semesters of the previous year at the departmental/national level and by type of property.

Evolution of the number of transactions - 73 - Porte-de-Savoie

Yearly data

Descending order
Year
Houses
house
transactions
Houses
house
Price per m²
Apartments
apt.
transactions
Apartments
apt.
Price per m²
2025
10
3 216 
3
3 750 
2024
21
3 696 
6
3 760 
2023
23
4 114 
7
3 722 
2022
38
3 746 
13
3 203 
2021
25
3 356 
17
2 449 
2020
31
2 951 
11
3 169 
2019
18
2 942 
13
2 500 
2018
27
2 387 
11
2 568 
2017
22
2 573 
8
2 268 
2016
23
2 295 
6
2 378 
2015
21
2 372 
8
2 872 
2014
16
2 906 
31
3 012 

Analysis

Structure of prices per m²

Values of price percentiles per m² over the periods used for the estimated price of each type of property.

Structure of transaction amounts

Values of transaction amounts percentiles over the periods used for the estimated price of each type of property.

Transaction amounts and prices per m² by percentile

Ascending order
Percentile
Houses
house
Price per m²
Houses
house
Transaction amount
Apartments
apt.
Price per m²
Apartments
apt.
Transaction amount
10th percentile
2 315 
156 K
2 047 
110 K
20th percentile
2 791 
245 K
2 740 
163 K
30th percentile
3 042 
285 K
3 186 
209 K
40th percentile
3 213 
296 K
3 638 
235 K
50th percentile
3 518 
304 K
3 748 
247 K
60th percentile
3 666 
350 K
3 759 
258 K
70th percentile
3 941 
387 K
3 792 
317 K
80th percentile
4 173 
419 K
3 878 
341 K
90th percentile
4 414 
510 K
4 001 
350 K

National and departmental comparison

Evolution of the median price per m² of houses

Evolution of the median price per m² of apartments

Quarterly evolution

Evolution of the median price per m²

Evolution of the number of transactions

Quarterly data

Descending order
Quarter
Houses
house
transactions
Houses
house
Price per m²
Apartments
apt.
transactions
Apartments
apt.
Price per m²
2025 Q2
5
3 222 
2
2 811 
2025 Q1
5
3 211 
1
4 020 
2024 Q4
4
4 498 
3
3 748 
2024 Q3
5
3 518 
2
3 246 
2024 Q2
4
2 610 
0
--- 
2024 Q1
8
4 024 
1
3 893 
2023 Q4
3
3 774 
2
3 380 
2023 Q3
11
4 285 
2
3 994 
2023 Q2
2
3 044 
2
3 738 
2023 Q1
7
4 329 
1
318 
2022 Q4
8
4 029 
1
2 774 
2022 Q3
12
4 052 
6
3 495 
2022 Q2
14
2 812 
4
2 994 
2022 Q1
4
3 488 
2
2 484 
2021 Q4
7
3 664 
1
3 505 
2021 Q3
8
2 919 
3
3 533 
2021 Q2
3
3 400 
8
2 014 
2021 Q1
7
3 356 
5
2 053 
2020 Q4
10
2 982 
4
2 620 
2020 Q3
8
2 324 
2
2 851 
2020 Q2
5
3 000 
2
2 788 
2020 Q1
8
3 077 
3
3 339 
2019 Q4
6
3 906 
3
2 537 
2019 Q3
6
2 647 
4
2 150 
2019 Q2
3
2 963 
3
3 031 
2019 Q1
3
3 304 
3
2 500 
2018 Q4
8
1 836 
2
2 636 
2018 Q3
9
2 816 
6
2 484 
2018 Q2
5
2 884 
1
3 007 
2018 Q1
5
2 765 
2
2 032 
2017 Q4
5
2 212 
3
1 389 
2017 Q3
7
2 520 
1
2 519 
2017 Q2
4
2 878 
2
2 514 
2017 Q1
6
2 484 
2
2 841 
2016 Q4
8
2 048 
4
2 257 
2016 Q3
8
2 370 
0
--- 
2016 Q2
5
2 295 
0
--- 
2016 Q1
2
2 274 
2
2 468 
2015 Q4
5
2 657 
1
253 
2015 Q3
8
2 368 
1
2 759 
2015 Q2
6
1 890 
3
2 902 
2015 Q1
2
1 952 
3
3 119 
2014 Q4
4
3 236 
24
3 026 
2014 Q3
5
2 899 
2
2 202 
2014 Q2
0
--- 
4
2 598 
2014 Q1
7
2 870 
1
773 

Overview of the latest real estate transactions

The following list is an anonymized overview of the latest transactions. For more details and to find all transactions, please use the map to view transactions by plot or the transaction search page for a search by criteria.

2025-06-27
980 
Sale
Land
880 m2
-Taillis simples
2025-06-11
185 000 
1 178  /m²(157 m²)
Sale
Commercial property
157 m2
2025-06-05
112 500 
3 750  /m²(30 m²)
Sale
Apartments
Apartment
1 room
30 m2
2025-05-12
1 380 
Sale
Land
1380 m2
-Landes
2025-05-06
294 730 
2 456  /m²(120 m²)
Sale
Houses
House
4 rooms
120 m2
Land
64 m2
-Sols
Land
82 m2
-Jardins
Land
82 m2
-Jardins
Land
40 m2
-Sols
Land
406 m2
-Jardins
2025-04-30
213 900 
Sale
Land
336 m2
-Sols
2025-04-29
285 000 
Sale
Land
87 m2
-Prés
2025-04-25
140 000 
1 750  /m²(80 m²)
Sale
Houses
House
3 rooms
80 m2
Land
384 m2
-Sols
Land
332 m2
-Jardins
Land
580 m2
-Jardins
Land
2245 m2
-Sols
Land
33579 m2
-Prés
Land
11196 m2
-Prés
Land
8633 m2
-Terres
Land
3046 m2
-Terres
Land
1032 m2
-Prés
Land
228 m2
-Prés
2025-04-24
33 000 
Sale
Land
1295 m2
-Vignes
Land
360 m2
-Sols
Land
174 m2
-Prés
2025-04-22
279 000 
1 872  /m²(149 m²)
Sale
Apartments
Apartment
2 rooms
35 m2
Apartments
Apartment
5 rooms
114 m2
1 outbuilding
Land
1200 m2
-Sols
Land
165 m2
-Terres
2025-04-11
282 300 
3 666  /m²(77 m²)
Sale
Houses
House
3 rooms
77 m2
Land
875 m2
-Prés
Land
500 m2
-Sols
2025-04-10
1 196 
Sale
Land
1680 m2
-Prés
Land
920 m2
-Terres
Land
2510 m2
-Terres
Land
870 m2
-Prés
2025-04-09
290 000 
3 222  /m²(90 m²)
Sale
Houses
House
3 rooms
90 m2
Land
319 m2
-Sols
Land
95 m2
-Sols
Land
13 m2
-Terres
Land
38 m2
-Terres
Land
104 m2
-Terres
2025-04-07
19 340 
Sale
Land
2210 m2
-Terres
Land
16340 m2
-Terres
Land
1440 m2
-Terres
2025-04-04
304 250 
3 666  /m²(83 m²)
Sale
Houses
House
3 rooms
83 m2
Land
40 m2
-Sols
Land
22 m2
-Sols
Land
26 m2
-Sols
2025-03-31
62 000 
Sale
Land
2273 m2
-Vignes
/Vins délimités de qualité supérieure
Land
8129 m2
-Vignes
/Vins délimités de qualité supérieure
2025-03-31
305 000 
3 211  /m²(95 m²)
Sale
Houses
House
5 rooms
95 m2
Land
807 m2
-Sols
2025-03-28
8 480 
Sale
Land
212 m2
-Vignes
/Vins délimités de qualité supérieure
2025-03-28
341 700 
4 020  /m²(85 m²)
Sale
Apartments
Apartment
4 rooms
85 m2
2 outbuildings
2025-03-26
160 000 
1 509  /m²(106 m²)
Sale
Houses
House
5 rooms
106 m2
Land
338 m2
-Sols
1202 transactions listed in the municipality

Savoie (73)

Most expensive cities

City
name
Descending orderHouses
house
Price per m²
41 730 
15 064 
9 926 
8 106 
7 708 
7 667 
7 570 
6 752 
6 184 
City
name
Descending orderApartments
apt.
Price per m²
12 707 
12 414 
10 959 
10 302 
8 611 
6 667 
6 146 
6 116 
5 770 

Least expensive cities

City
name
Ascending orderHouses
house
Price per m²
1 250 
1 316 
1 333 
1 344 
1 354 
1 384 
1 500 
City
name
Ascending orderApartments
apt.
Price per m²
400 
520 
528 
672 
797