emooki
HomePrice mapTransactions
🇬🇧 English🇫🇷 Français🇩🇪 Deutsch🇪🇸 Español🇮🇹 Italiano

Real estate price map


Real estate price map in the municipality of Saint-Jeoire-Prieuré.

Savoie (73)
Saint-Jeoire-Prieuré

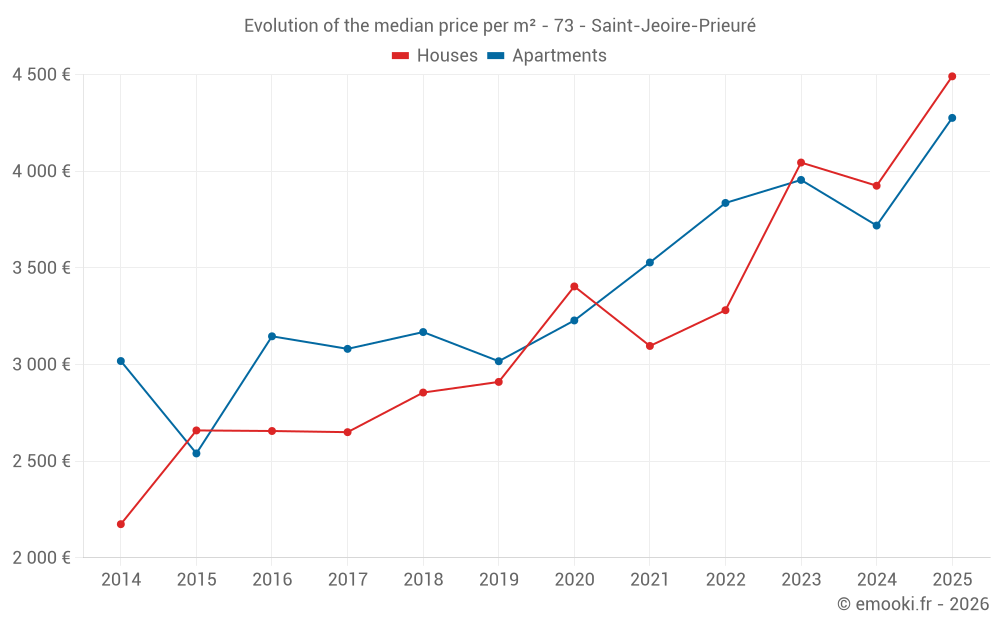
Median price of real estate
in the municipality of Saint-Jeoire-Prieuré

HousesHouses
3 925  /m²
1-23-45-67-89-10
Reliability 7/10
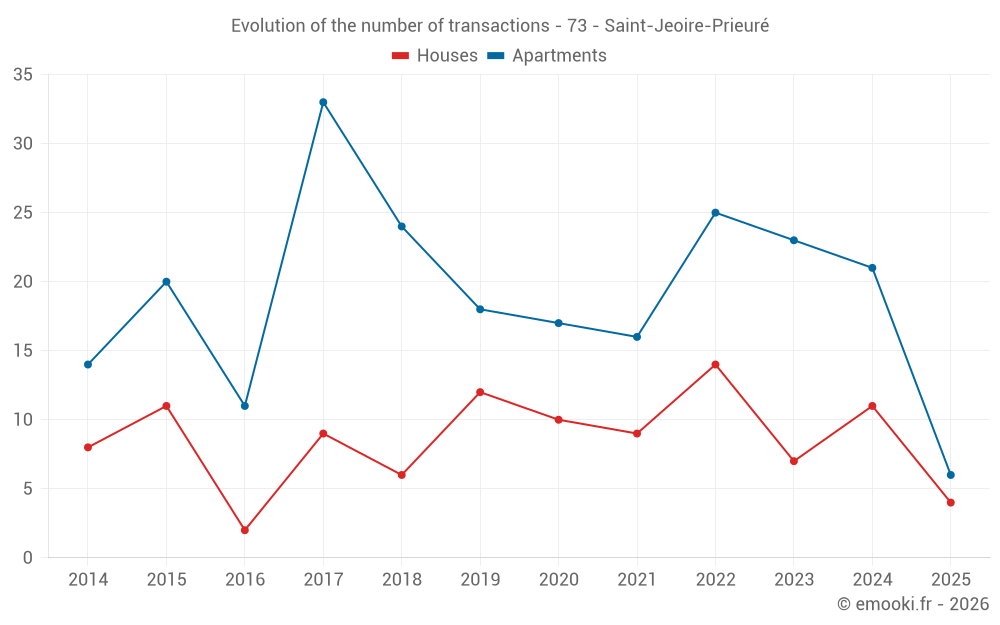
Median price on the 19 transactions of the last 24 months.
from 3 311 to
4 482  /m²
60% of transactions from the 2nd to the 8th deciles.
ApartmentsApartments
3 884  /m²
1-23-45-67-89-10
Reliability 8/10
Median price on the 21 transactions of the last 12 months.
from 3 104 to
4 125  /m²
60% of transactions from the 2nd to the 8th deciles.
DwellingsDwellings
3 976  /m²
1-23-45-67-89-10
Reliability 8/10
Median price on the 29 transactions of the last 12 months.
from 3 480 to
4 442  /m²
60% of transactions from the 2nd to the 8th deciles.
HousesEvolution of the price per m² of houses since...
1 year
--
2 years
--
3 years
--
4 years
--
5 years
--
6 years
--
7 years
--
8 years
--
9 years
--
10 years
--
11 years
--
ApartmentsEvolution of the price per m² of apartments since...
1 year
+15%
2 years
+8.1%
3 years
+11%
4 years
+21%
5 years
+32%
6 years
+42%
7 years
+35%
8 years
+39%
9 years
+36%
10 years
+68%
11 years
+42%

Yearly evolution

Evolution of the median price per m²

Evolution of the number of transactions

Warning, last year incomplete. Projections made based on the proportions between semesters of the previous year at the departmental/national level and by type of property.

Yearly data

Descending order
Year
Houses
house
transactions
Houses
house
Price per m²
Apartments
apt.
transactions
Apartments
apt.
Price per m²
2025
4
4 491 
6
4 276 
2024
11
3 925 
21
3 719 
2023
7
4 045 
23
3 955 
2022
14
3 281 
25
3 836 
2021
9
3 096 
16
3 528 
2020
10
3 404 
17
3 228 
2019
12
2 910 
18
3 017 
2018
6
2 855 
24
3 168 
2017
9
2 650 
33
3 081 
2016
2
2 656 
11
3 146 
2015
11
2 659 
20
2 540 
2014
8
2 174 
14
3 018 

Analysis

Structure of prices per m²

Values of price percentiles per m² over the periods used for the estimated price of each type of property.

Structure of transaction amounts

Values of transaction amounts percentiles over the periods used for the estimated price of each type of property.

Transaction amounts and prices per m² by percentile

Ascending order
Percentile
Houses
house
Price per m²
Houses
house
Transaction amount
Apartments
apt.
Price per m²
Apartments
apt.
Transaction amount
10th percentile
2 847 
264 K
3 041 
175 K
20th percentile
3 311 
307 K
3 104 
238 K
30th percentile
3 629 
350 K
3 534 
251 K
40th percentile
3 837 
378 K
3 719 
258 K
50th percentile
3 925 
430 K
3 884 
271 K
60th percentile
4 288 
434 K
3 976 
296 K
70th percentile
4 399 
505 K
4 064 
310 K
80th percentile
4 482 
613 K
4 125 
350 K
90th percentile
4 901 
684 K
4 441 
362 K

National and departmental comparison

Evolution of the median price per m² of houses

Evolution of the median price per m² of apartments

Quarterly evolution

Evolution of the median price per m²

Evolution of the number of transactions

Quarterly data

Descending order
Quarter
Houses
house
transactions
Houses
house
Price per m²
Apartments
apt.
transactions
Apartments
apt.
Price per m²
2025 Q2
3
4 444 
3
4 441 
2025 Q1
1
4 538 
3
3 884 
2024 Q4
3
4 427 
9
3 534 
2024 Q3
1
3 699 
6
3 936 
2024 Q2
3
3 925 
2
3 974 
2024 Q1
4
3 009 
4
3 286 
2023 Q4
3
3 447 
8
3 946 
2023 Q3
1
3 010 
3
3 955 
2023 Q2
3
4 090 
6
3 890 
2023 Q1
0
--- 
6
3 840 
2022 Q4
2
3 612 
6
3 958 
2022 Q3
2
1 714 
10
3 870 
2022 Q2
2
4 508 
5
4 034 
2022 Q1
8
3 030 
4
2 488 
2021 Q4
1
3 472 
6
3 528 
2021 Q3
5
3 500 
3
4 036 
2021 Q2
1
2 468 
6
3 414 
2021 Q1
2
3 010 
1
3 922 
2020 Q4
3
3 769 
5
3 294 
2020 Q3
4
3 338 
4
2 958 
2020 Q2
0
--- 
4
3 305 
2020 Q1
3
2 973 
4
3 477 
2019 Q4
5
2 917 
3
3 208 
2019 Q3
5
2 500 
3
1 626 
2019 Q2
2
3 690 
2
2 212 
2019 Q1
0
--- 
10
3 017 
2018 Q4
3
2 854 
7
3 282 
2018 Q3
2
2 900 
4
3 058 
2018 Q2
1
2 752 
8
3 040 
2018 Q1
0
--- 
5
3 218 
2017 Q4
1
3 217 
13
3 156 
2017 Q3
0
--- 
4
2 750 
2017 Q2
8
2 630 
7
3 000 
2017 Q1
0
--- 
9
2 951 
2016 Q4
1
2 690 
5
3 146 
2016 Q3
1
2 622 
1
2 993 
2016 Q2
0
--- 
4
3 248 
2016 Q1
0
--- 
1
3 177 
2015 Q4
3
2 748 
5
2 550 
2015 Q3
3
3 302 
6
2 540 
2015 Q2
1
2 521 
5
2 680 
2015 Q1
4
2 394 
4
2 170 
2014 Q4
1
1 
4
3 126 
2014 Q3
2
2 402 
3
3 002 
2014 Q2
1
870 
3
2 805 
2014 Q1
4
2 505 
4
3 000 

Savoie (73)

Most expensive cities

City
name
Descending orderHouses
house
Price per m²
41 730 
15 064 
9 926 
8 106 
7 708 
7 667 
7 570 
6 752 
6 184 
City
name
Descending orderApartments
apt.
Price per m²
12 707 
12 414 
10 959 
10 302 
8 611 
6 667 
6 146 
6 116 
5 770 

Least expensive cities

City
name
Ascending orderHouses
house
Price per m²
1 250 
1 316 
1 333 
1 344 
1 354 
1 384 
1 500 
City
name
Ascending orderApartments
apt.
Price per m²
400 
520 
528 
672 
797