Median price of real estate
in the municipality of Challes-les-Eaux
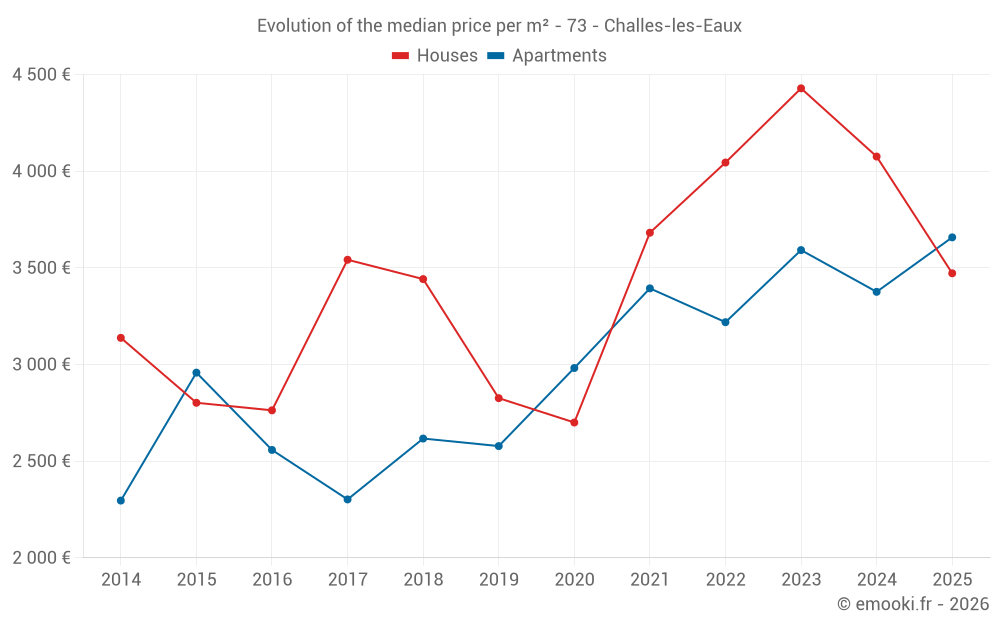
Houses
3 844 € /m²
Reliability 8/10
Median price on the 23 transactions of the last 12 months.
from 3 239 to
4 557 € /m²
4 557 € /m²
60% of transactions from the 2nd to the 8th deciles.
Apartments
3 658 € /m²
Reliability 9/10
Median price on the 29 transactions of the last 6 months.
from 2 796 to
4 048 € /m²
4 048 € /m²
60% of transactions from the 2nd to the 8th deciles.
Dwellings
3 657 € /m²
Reliability 9/10
Median price on the 39 transactions of the last 6 months.
from 2 779 to
4 124 € /m²
4 124 € /m²
60% of transactions from the 2nd to the 8th deciles.