emooki
HomePrice mapTransactions
🇬🇧 English🇫🇷 Français🇩🇪 Deutsch🇪🇸 Español🇮🇹 Italiano

Real estate price map


Real estate price map in the municipality of Aillon-le-Vieux, choose a section to see transactions by parcel.

Savoie (73)

Aillon-le-Vieux - Real estate price m²

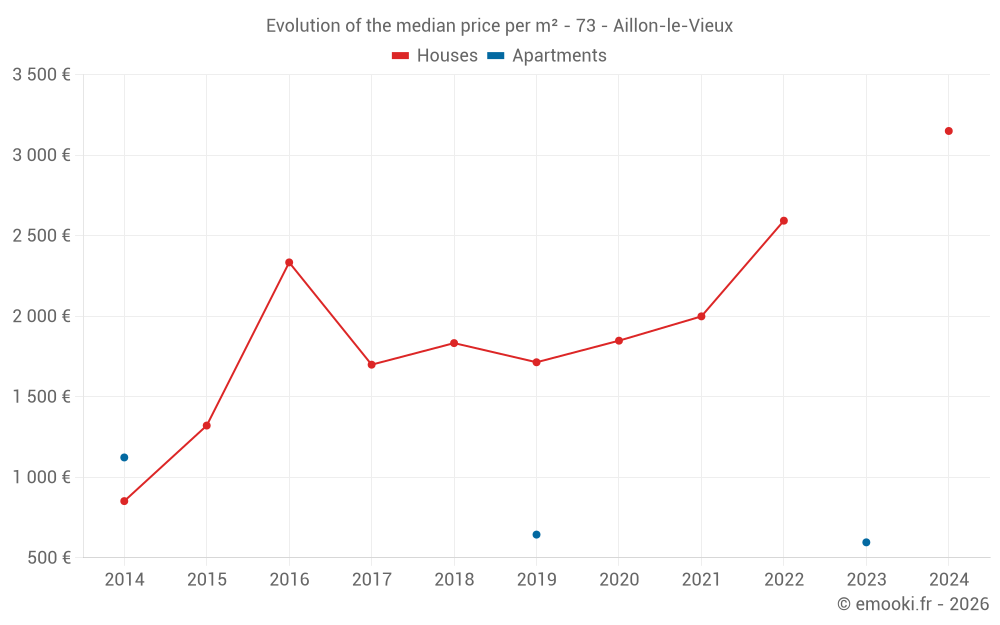
Median price of real estate
in the municipality of Aillon-le-Vieux

HousesHouses
2 450  /m²
1-23-45-67-89-10
Reliability 4/10
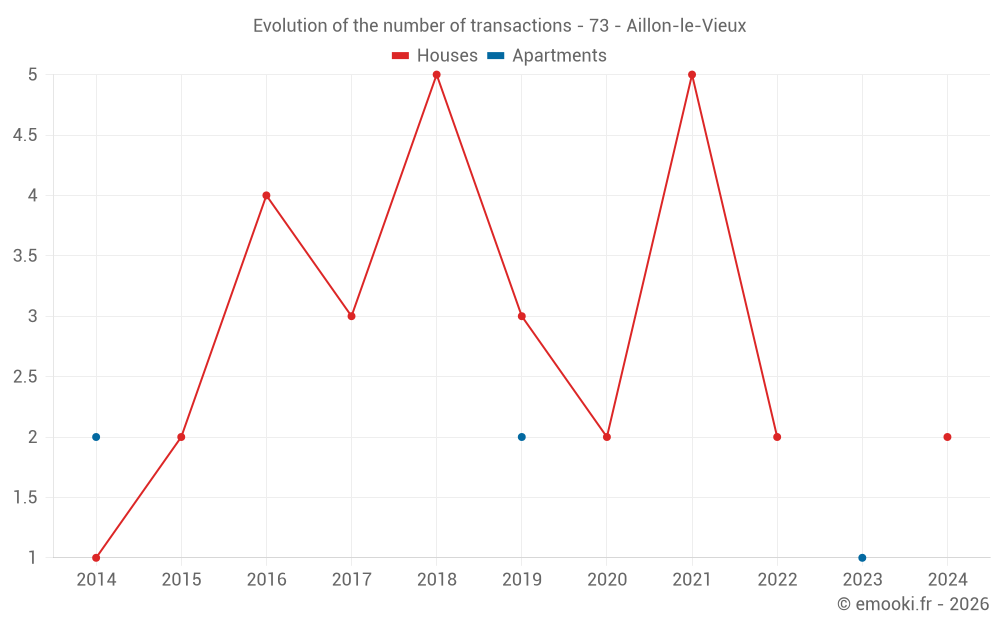
Median price on the 10 transactions of the last 60 months.
ApartmentsApartments
596  /m²
1-23-45-67-89-10
Reliability 1/10
Median price on the 3 transactions of the last 120 months.
DwellingsDwellings
2 338  /m²
1-23-45-67-89-10
Reliability 4/10
Median price on the 11 transactions of the last 60 months.
from 1 135 to
2 841  /m²
60% of transactions from the 2nd to the 8th deciles.

Yearly evolution

Evolution of the median price per m²

Evolution of the median price per m² - 73 - Aillon-le-Vieux

Evolution of the number of transactions

Warning, last year incomplete.

Evolution of the number of transactions - 73 - Aillon-le-Vieux

Yearly data

Descending order
Year
Houses
house
transactions
Houses
house
Price per m²
Apartments
apt.
transactions
Apartments
apt.
Price per m²
2025
0
--- 
0
--- 
2024
2
3 150 
0
--- 
2023
0
--- 
1
596 
2022
2
2 593 
0
--- 
2021
5
1 999 
0
--- 
2020
2
1 848 
0
--- 
2019
3
1 714 
2
644 
2018
5
1 833 
0
--- 
2017
3
1 699 
0
--- 
2016
4
2 334 
0
--- 
2015
2
1 321 
0
--- 
2014
1
852 
2
1 123 

Analysis

Structure of prices per m²

Values of price percentiles per m² over the periods used for the estimated price of each type of property.

Structure of transaction amounts

Values of transaction amounts percentiles over the periods used for the estimated price of each type of property.

Transaction amounts and prices per m² by percentile

Ascending order
Percentile
Houses
house
Price per m²
Houses
house
Transaction amount
Apartments
apt.
Price per m²
Apartments
apt.
Transaction amount
10th percentile
1 098 
133 K
586 
54 000 
20th percentile
1 826 
178 K
589 
63 000 
30th percentile
2 061 
203 K
591 
72 000 
40th percentile
2 238 
210 K
594 
81 000 
50th percentile
2 450 
253 K
596 
90 000 
60th percentile
2 587 
314 K
617 
92 250 
70th percentile
2 690 
358 K
639 
94 500 
80th percentile
2 854 
414 K
660 
96 750 
90th percentile
2 954 
512 K
682 
99 000 

National and departmental comparison

Evolution of the median price per m² of houses

Evolution of the median price per m² of apartments

Quarterly evolution

Evolution of the median price per m²

Evolution of the number of transactions

Quarterly data

Descending order
Quarter
Houses
house
transactions
Houses
house
Price per m²
Apartments
apt.
transactions
Apartments
apt.
Price per m²
2024 Q2
2
3 150 
0
--- 
2023 Q3
0
--- 
1
596 
2022 Q3
1
2 625 
0
--- 
2022 Q2
1
2 561 
0
--- 
2021 Q4
2
1 988 
0
--- 
2021 Q3
1
767 
0
--- 
2021 Q2
1
2 088 
0
--- 
2021 Q1
1
1 999 
0
--- 
2020 Q3
1
2 338 
0
--- 
2020 Q1
1
1 357 
0
--- 
2019 Q4
1
1 750 
0
--- 
2019 Q3
1
1 714 
1
584 
2019 Q2
1
1 647 
0
--- 
2019 Q1
0
--- 
1
703 
2018 Q4
2
2 068 
0
--- 
2018 Q3
1
3 991 
0
--- 
2018 Q1
2
1 126 
0
--- 
2017 Q3
2
2 010 
0
--- 
2017 Q2
1
1 385 
0
--- 
2016 Q3
1
3 723 
0
--- 
2016 Q2
2
2 106 
0
--- 
2016 Q1
1
2 549 
0
--- 
2015 Q1
2
1 321 
0
--- 
2014 Q4
0
--- 
1
1 613 
2014 Q3
1
852 
0
--- 
2014 Q2
0
--- 
1
633 

Overview of the latest real estate transactions

The following list is an anonymized overview of the latest transactions. For more details and to find all transactions, please use the map to view transactions by plot or the transaction search page for a search by criteria.

2025-03-06
300 
Sale
Land
132 m2
-Jardins
Land
135 m2
-Prés
2024-12-13
52 000 
Sale
Land
375 m2
-Sols
Land
240 m2
-Sols
2024-11-29
3 220 
Sale
Land
92 m2
-Jardins
2024-09-16
138 000 
Sale
Land
738 m2
-Prés
Land
257 m2
-Prés
Land
323 m2
-Sols
2024-05-23
342 750 
3 394  /m²(101 m²)
Sale
Houses
House
3 rooms
101 m2
Land
240 m2
-Sols
2024-05-18
392 180 
2 905  /m²(135 m²)
Sale
Houses
House
6 rooms
135 m2
Land
1028 m2
-Sols
2024-05-06
1 500 
9  /m²(170 m²)
Exchange
Apartments
Apartment
5 rooms
170 m2
2 outbuildings
Land
740 m2
-Prés
2024-04-19
870 
Sale
Land
610 m2
-Prés
Land
460 m2
-Pâtures
/Pâture plantée
Land
410 m2
-Prés
Land
305 m2
-Prés
Land
685 m2
-Prés
2024-03-14
34 000 
Sale
Land
240 m2
-Sols
2023-12-22
699 
Sale
Land
699 m2
-Prés
2023-09-07
101 250 
596  /m²(170 m²)
Sale
Apartments
Apartment
5 rooms
170 m2
2 outbuildings
2023-05-31
2 600 
Sale
Land
251 m2
-Prés
2023-04-15
50 000 
113  /m²(444 m²)
Sale
Commercial property
444 m2
Land
6828 m2
-Sols
2023-03-28
500 000 
4 545  /m²(110 m²)
Sale
Houses
House
4 rooms
110 m2
Land
1130 m2
-Sols
Land
1480 m2
-Taillis simples
Land
5060 m2
-Taillis simples
Land
10200 m2
-Futaies résineuses
Land
452 m2
-Taillis simples
Land
5665 m2
-Taillis simples
Land
990 m2
-Prés
Land
1570 m2
-Prés
Land
730 m2
-Taillis simples
Land
3370 m2
-Prés
Land
3520 m2
-Futaies résineuses
Land
4448 m2
-Prés
Land
3605 m2
-Prés
Land
945 m2
-Prés
Land
1525 m2
-Prés
Land
504 m2
-Prés
Land
2090 m2
-Prés
Land
420 m2
-Taillis simples
Land
739 m2
-Taillis simples
Land
6930 m2
-Taillis simples
Land
14360 m2
-Futaies résineuses
Land
790 m2
-Taillis simples
Land
830 m2
-Taillis simples
Land
488 m2
-Taillis simples
Land
487 m2
-Taillis simples
Land
1637 m2
-Taillis simples
Land
1638 m2
-Taillis simples
Land
4300 m2
-Taillis simples
Land
7287 m2
-Prés
Land
8732 m2
-Prés
2022-12-07
870 
Sale
Land
610 m2
-Prés
Land
460 m2
-Pâtures
/Pâture plantée
Land
410 m2
-Prés
Land
305 m2
-Prés
Land
685 m2
-Prés
2022-11-29
215 000 
Sale
Land
338 m2
-Prés
Land
1000 m2
-Sols
Land
6384 m2
-Prés
2022-11-16
200 
Exchange
Land
245 m2
-Prés
2022-07-20
210 000 
2 625  /m²(80 m²)
Sale
Houses
House
5 rooms
80 m2
Land
610 m2
-Sols
Land
161 m2
-Jardins
Land
102 m2
-Sols
2022-05-25
210 000 
2 561  /m²(82 m²)
Sale
Houses
House
4 rooms
82 m2
Land
515 m2
-Sols
Land
488 m2
-Jardins
2022-04-29
432 
Sale
Land
1235 m2
-Prés
87 transactions listed in the municipality

Savoie (73)

Most expensive cities

City
name
Descending orderHouses
house
Price per m²
41 730 
15 064 
9 926 
8 106 
7 708 
7 667 
7 570 
6 752 
6 184 
City
name
Descending orderApartments
apt.
Price per m²
12 707 
12 414 
10 959 
10 302 
8 611 
6 667 
6 146 
6 116 
5 770 

Least expensive cities

City
name
Ascending orderHouses
house
Price per m²
1 250 
1 316 
1 333 
1 344 
1 354 
1 384 
1 500 
City
name
Ascending orderApartments
apt.
Price per m²
400 
520 
528 
672 
797