emooki
HomePrice mapTransactions
🇬🇧 English🇫🇷 Français🇩🇪 Deutsch🇪🇸 Español🇮🇹 Italiano

Real estate price map


Real estate price map in the municipality of Chignin, choose a section to see transactions by parcel.

Savoie (73)

Chignin - Real estate price m²

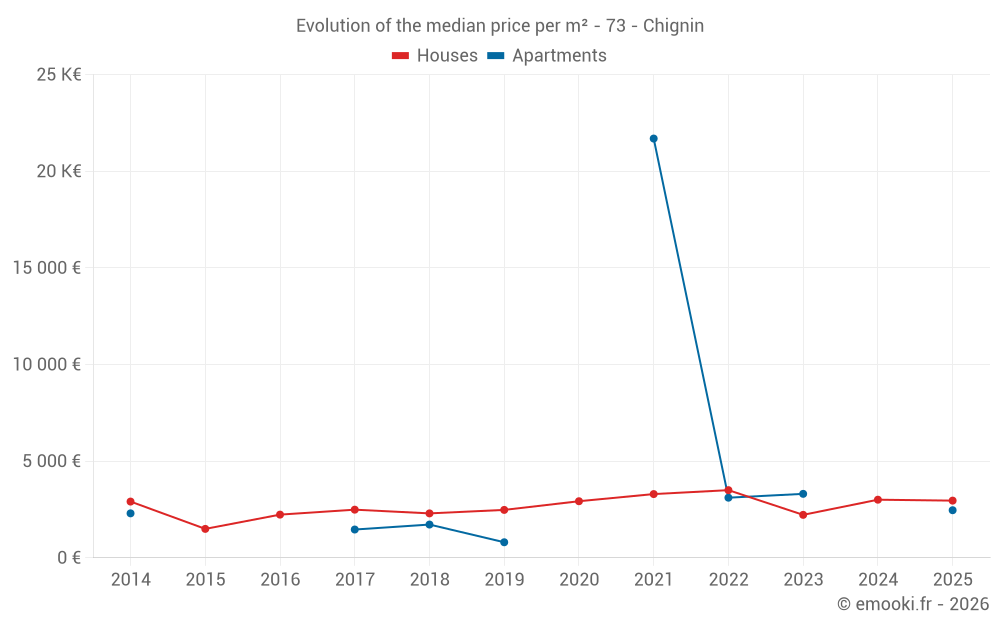
Median price of real estate
in the municipality of Chignin

HousesHouses
2 903  /m²
1-23-45-67-89-10
Reliability 6/10
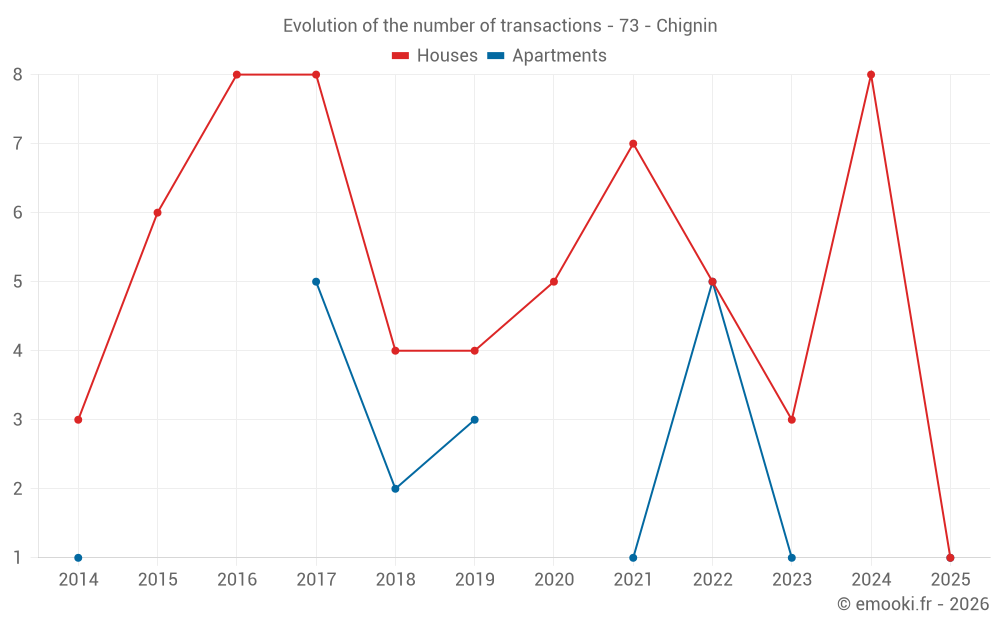
Median price on the 13 transactions of the last 36 months.
from 2 023 to
3 480  /m²
60% of transactions from the 2nd to the 8th deciles.
ApartmentsApartments
3 138  /m²
1-23-45-67-89-10
Reliability 4/10
Median price on the 8 transactions of the last 60 months.
DwellingsDwellings
2 903  /m²
1-23-45-67-89-10
Reliability 6/10
Median price on the 19 transactions of the last 36 months.
from 1 760 to
3 431  /m²
60% of transactions from the 2nd to the 8th deciles.

Yearly evolution

Evolution of the median price per m²

Evolution of the median price per m² - 73 - Chignin

Evolution of the number of transactions

Warning, last year incomplete. Projections made based on the proportions between semesters of the previous year at the departmental/national level and by type of property.

Evolution of the number of transactions - 73 - Chignin

Yearly data

Descending order
Year
Houses
house
transactions
Houses
house
Price per m²
Apartments
apt.
transactions
Apartments
apt.
Price per m²
2025
1
2 958 
1
2 462 
2024
8
3 006 
0
--- 
2023
3
2 222 
1
3 309 
2022
5
3 500 
5
3 110 
2021
7
3 297 
1
21 691 
2020
5
2 927 
0
--- 
2019
4
2 478 
3
804 
2018
4
2 298 
2
1 720 
2017
8
2 490 
5
1 463 
2016
8
2 234 
0
--- 
2015
6
1 496 
0
--- 
2014
3
2 909 
1
2 300 

Analysis

Structure of prices per m²

Values of price percentiles per m² over the periods used for the estimated price of each type of property.

Structure of transaction amounts

Values of transaction amounts percentiles over the periods used for the estimated price of each type of property.

Transaction amounts and prices per m² by percentile

Ascending order
Percentile
Houses
house
Price per m²
Houses
house
Transaction amount
Apartments
apt.
Price per m²
Apartments
apt.
Transaction amount
10th percentile
1 515 
138 K
1 515 
135 K
20th percentile
2 023 
171 K
1 923 
154 K
30th percentile
2 284 
207 K
2 527 
172 K
40th percentile
2 596 
219 K
2 980 
255 K
50th percentile
2 903 
237 K
3 138 
280 K
60th percentile
2 988 
301 K
3 195 
285 K
70th percentile
3 176 
311 K
3 295 
299 K
80th percentile
3 480 
339 K
4 538 
408 K
90th percentile
3 843 
417 K
10 257 
602 K

National and departmental comparison

Evolution of the median price per m² of houses

Evolution of the median price per m² of apartments

Quarterly evolution

Evolution of the median price per m²

Evolution of the number of transactions

Quarterly data

Descending order
Quarter
Houses
house
transactions
Houses
house
Price per m²
Apartments
apt.
transactions
Apartments
apt.
Price per m²
2025 Q2
1
2 958 
1
2 462 
2024 Q4
2
2 784 
0
--- 
2024 Q3
2
2 518 
0
--- 
2024 Q2
3
3 108 
0
--- 
2024 Q1
1
3 278 
0
--- 
2023 Q4
1
2 326 
0
--- 
2023 Q3
1
1 891 
1
3 309 
2023 Q1
1
2 222 
0
--- 
2022 Q4
0
--- 
3
3 167 
2022 Q3
1
3 965 
1
1 403 
2022 Q2
3
3 500 
1
3 110 
2022 Q1
1
2 871 
0
--- 
2021 Q4
0
--- 
1
21 691 
2021 Q3
4
3 310 
0
--- 
2021 Q2
1
2 163 
0
--- 
2021 Q1
2
2 494 
0
--- 
2020 Q4
1
2 394 
0
--- 
2020 Q3
2
2 423 
0
--- 
2020 Q1
2
3 041 
0
--- 
2019 Q4
0
--- 
1
1 049 
2019 Q2
3
2 567 
1
606 
2019 Q1
1
2 390 
1
804 
2018 Q4
1
2 310 
0
--- 
2018 Q3
2
2 190 
2
1 720 
2018 Q2
1
4 280 
0
--- 
2017 Q4
2
2 059 
0
--- 
2017 Q3
2
2 210 
2
1 581 
2017 Q2
2
2 891 
1
318 
2017 Q1
2
2 624 
2
2 020 
2016 Q4
3
2 203 
0
--- 
2016 Q3
3
1 875 
0
--- 
2016 Q1
2
2 422 
0
--- 
2015 Q4
3
1 125 
0
--- 
2015 Q3
2
5 140 
0
--- 
2015 Q2
1
1 013 
0
--- 
2014 Q3
1
2 136 
1
2 300 
2014 Q2
1
3 166 
0
--- 
2014 Q1
1
2 909 
0
--- 

Overview of the latest real estate transactions

The following list is an anonymized overview of the latest transactions. For more details and to find all transactions, please use the map to view transactions by plot or the transaction search page for a search by criteria.

2025-06-06
3 832 
Sale
Land
479 m2
-Vignes
/Vins délimités de qualité supérieure
2025-06-05
25 000 
Sale
Land
1243 m2
-Sols
2025-05-20
304 680 
2 958  /m²(103 m²)
Sale
Houses
House
6 rooms
103 m2
1 outbuilding
Land
441 m2
-Sols
2025-04-17
160 000 
2 462  /m²(65 m²)
Sale
Apartments
Apartment
3 rooms
65 m2
2025-03-07
19 528 
Sale
Land
2240 m2
-Landes
/Friche
Land
1440 m2
-Prés
Land
82 m2
-Sols
2025-02-21
78 744 
Sale
Land
302 m2
-Vignes
/Vins délimités de qualité supérieure
Land
2088 m2
-Terres
Land
1042 m2
-Vignes
/Vins délimités de qualité supérieure
Land
424 m2
-Terres
Land
410 m2
-Terres
Land
545 m2
-Vignes
/Vins délimités de qualité supérieure
Land
60 m2
-Prés
Land
310 m2
-Terres
Land
1740 m2
-Vignes
/Vins délimités de qualité supérieure
Land
200 m2
-Terres
Land
1185 m2
-Vignes
/Vins délimités de qualité supérieure
Land
902 m2
-Prés
Land
635 m2
-Vignes
/Vins délimités de qualité supérieure
2025-01-24
96 140 
Sale
Land
437 m2
-Terres
2024-12-20
1 980 000 
Sale
Land
40303 m2
-Sols
2024-12-16
700 
Sale
Land
2575 m2
-Landes
/Friche
2024-12-10
237 080 
2 664  /m²(89 m²)
Sale
Houses
House
5 rooms
89 m2
Land
625 m2
-Jardins
Land
645 m2
-Sols
2024-11-15
90 000 
2 903  /m²(31 m²)
Sale
Houses
House
3 rooms
31 m2
1 outbuilding
Land
335 m2
-Sols
2024-10-23
6 192 
Sale
Land
1376 m2
-Vignes
/Vins délimités de qualité supérieure
2024-09-27
433 650 
3 614  /m²(120 m²)
Sale
Houses
House
4 rooms
120 m2
Land
108 m2
-Sols
Land
99 m2
-Sols
Land
470 m2
-Terres
Land
54 m2
-Sols
2024-09-26
19 488 
Sale
Land
17621 m2
-Prés
2024-09-17
100 
Sale
Land
7 m2
-Jardins
2024-09-16
11 000 
Sale
Land
862 m2
-Vignes
/Vins délimités de qualité supérieure
Land
812 m2
-Vignes
/Vins délimités de qualité supérieure
2024-09-13
2 280 
Sale
Land
612 m2
-Prés
Land
855 m2
-Terres
2024-09-13
4 900 
Sale
Land
246 m2
-Prés
Land
1380 m2
-Terres
2024-09-13
30 000 
Sale
Land
92 m2
-Terrains à bâtir
Land
314 m2
-Terrains à bâtir
Land
1408 m2
-Prés
2024-09-03
11 975 
Sale
Land
1198 m2
-Prés
Land
1197 m2
-Prés
289 transactions listed in the municipality

Savoie (73)

Most expensive cities

City
name
Descending orderHouses
house
Price per m²
41 730 
15 064 
9 926 
8 106 
7 708 
7 667 
7 570 
6 752 
6 184 
City
name
Descending orderApartments
apt.
Price per m²
12 707 
12 414 
10 959 
10 302 
8 611 
6 667 
6 146 
6 116 
5 770 

Least expensive cities

City
name
Ascending orderHouses
house
Price per m²
1 250 
1 316 
1 333 
1 344 
1 354 
1 384 
1 500 
City
name
Ascending orderApartments
apt.
Price per m²
400 
520 
528 
672 
797