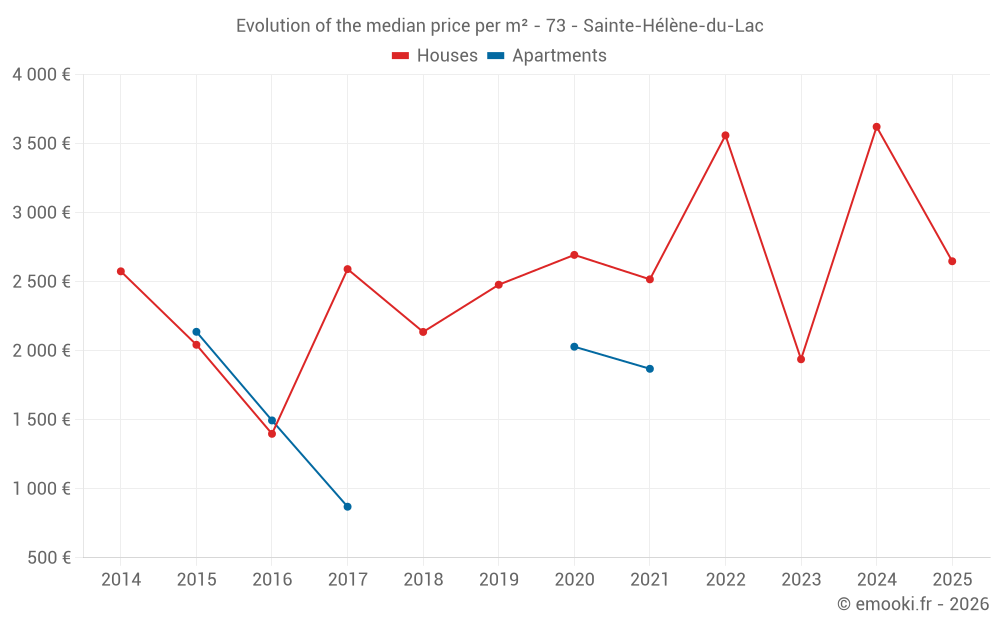
Median price of real estate
in the municipality of Sainte-Hélène-du-Lac
Houses
3 125 € /m²
Reliability 6/10
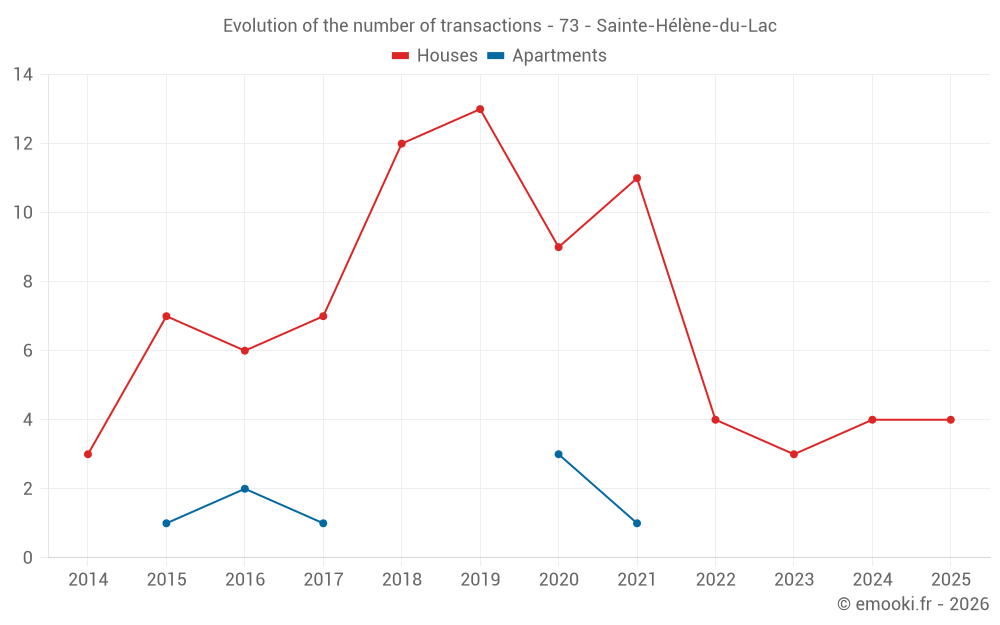
Median price on the 13 transactions of the last 36 months.
from 1 758 to
4 139 € /m²
4 139 € /m²
60% of transactions from the 2nd to the 8th deciles.
Apartments
2 000 € /m²
Reliability 2/10
Median price on the 5 transactions of the last 96 months.
Dwellings
3 125 € /m²
Reliability 6/10
Median price on the 13 transactions of the last 36 months.
from 1 758 to
4 139 € /m²
4 139 € /m²
60% of transactions from the 2nd to the 8th deciles.