emooki
HomePrice mapTransactions
🇬🇧 English🇫🇷 Français🇩🇪 Deutsch🇪🇸 Español🇮🇹 Italiano

Real estate price map


Real estate price map in the municipality of Giat, choose a section to see transactions by parcel.

Puy-de-Dôme (63)

Giat - Real estate price m²

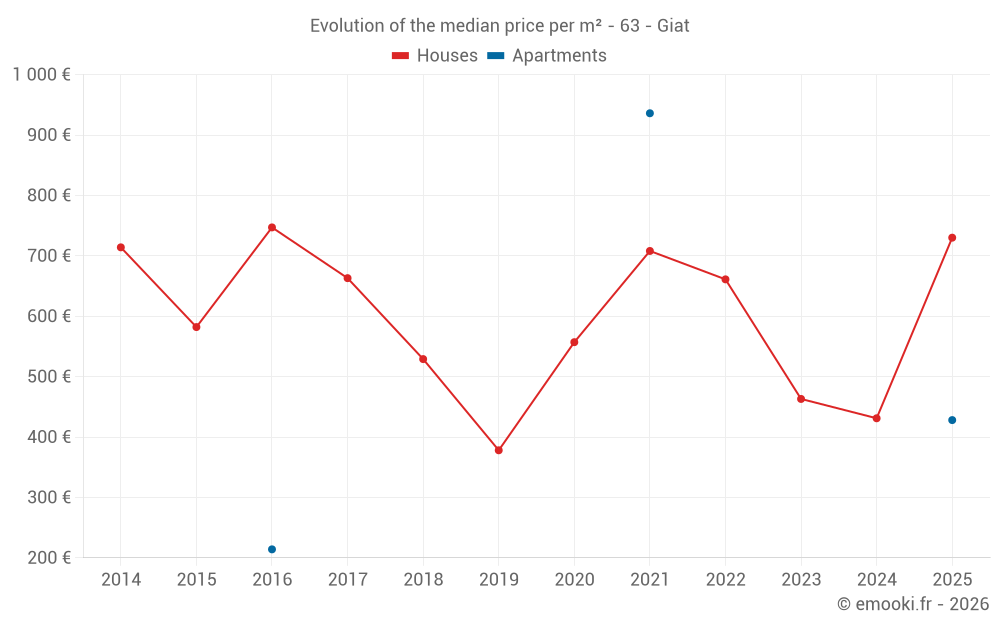
Median price of real estate
in the municipality of Giat

HousesHouses
492  /m²
1-23-45-67-89-10
Reliability 7/10
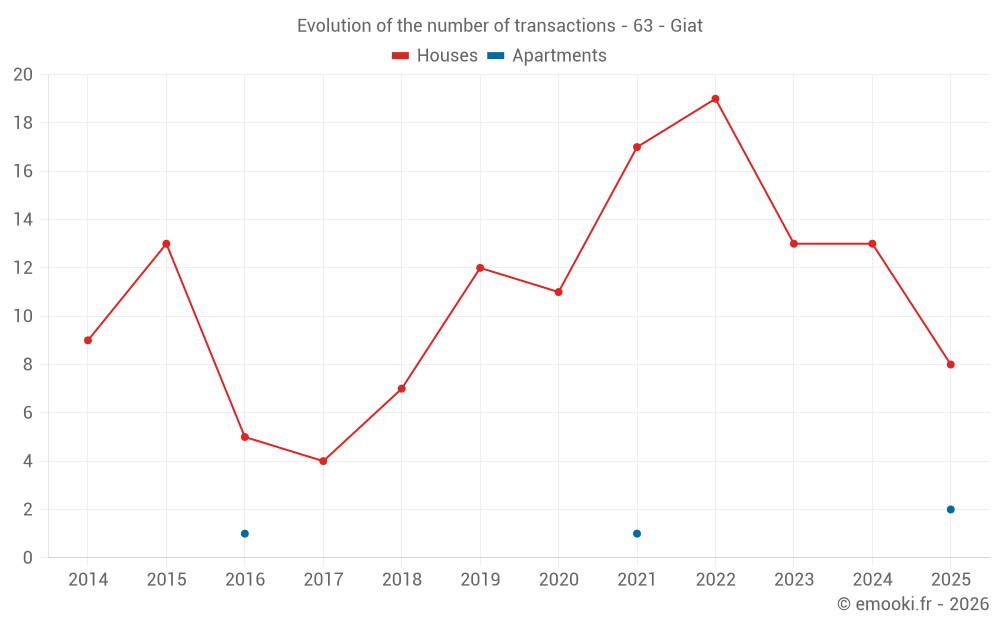
Median price on the 30 transactions of the last 24 months.
from 211 to
1 034  /m²
60% of transactions from the 2nd to the 8th deciles.
ApartmentsApartments
428  /m²
1-23-45-67-89-10
Reliability 1/10
Median price on the 4 transactions of the last 120 months.
DwellingsDwellings
523  /m²
1-23-45-67-89-10
Reliability 8/10
Median price on the 17 transactions of the last 12 months.
from 311 to
991  /m²
60% of transactions from the 2nd to the 8th deciles.
HousesEvolution of the price per m² of houses since...
1 year
+69%
2 years
+58%
3 years
+10%
4 years
+3.1%
5 years
+31%
6 years
+93%
7 years
+38%
8 years
+10%
9 years
-2.3%
10 years
+25%
11 years
+2.2%
The price per m² of houses has increased by 93% since 6 years, but it has decreased by 2.3% in 9 years.

Yearly evolution

Evolution of the median price per m²

Evolution of the median price per m² - 63 - Giat

Evolution of the number of transactions

Warning, last year incomplete. Projections made based on the proportions between semesters of the previous year at the departmental/national level and by type of property.

Evolution of the number of transactions - 63 - Giat

Yearly data

Descending order
Year
Houses
house
transactions
Houses
house
Price per m²
Apartments
apt.
transactions
Apartments
apt.
Price per m²
2025
8
730 
2
428 
2024
13
431 
0
--- 
2023
13
463 
0
--- 
2022
19
661 
0
--- 
2021
17
708 
1
936 
2020
11
557 
0
--- 
2019
12
378 
0
--- 
2018
7
529 
0
--- 
2017
4
663 
0
--- 
2016
5
747 
1
214 
2015
13
582 
0
--- 
2014
9
714 
0
--- 

Analysis

Structure of prices per m²

Values of price percentiles per m² over the periods used for the estimated price of each type of property.

Structure of transaction amounts

Values of transaction amounts percentiles over the periods used for the estimated price of each type of property.

Transaction amounts and prices per m² by percentile

Ascending order
Percentile
Houses
house
Price per m²
Houses
house
Transaction amount
Apartments
apt.
Price per m²
Apartments
apt.
Transaction amount
10th percentile
153 
12 700 
275 
42 628 
20th percentile
211 
26 240 
336 
55 256 
30th percentile
276 
30 000 
397 
67 884 
40th percentile
428 
37 400 
422 
72 674 
50th percentile
492 
51 000 
428 
73 546 
60th percentile
627 
71 600 
435 
74 419 
70th percentile
951 
95 100 
490 
79 670 
80th percentile
1 034 
113 K
638 
93 680 
90th percentile
1 360 
134 K
787 
108 K

National and departmental comparison

Evolution of the median price per m² of houses

Evolution of the median price per m² of apartments

Quarterly evolution

Evolution of the median price per m²

Evolution of the number of transactions

Quarterly data

Descending order
Quarter
Houses
house
transactions
Houses
house
Price per m²
Apartments
apt.
transactions
Apartments
apt.
Price per m²
2025 Q2
5
938 
1
417 
2025 Q1
3
429 
1
440 
2024 Q4
4
594 
0
--- 
2024 Q3
3
994 
0
--- 
2024 Q2
4
180 
0
--- 
2024 Q1
2
410 
0
--- 
2023 Q4
4
230 
0
--- 
2023 Q3
5
1 340 
0
--- 
2023 Q2
3
913 
0
--- 
2023 Q1
1
233 
0
--- 
2022 Q4
3
661 
0
--- 
2022 Q3
6
1 016 
0
--- 
2022 Q2
4
546 
0
--- 
2022 Q1
6
454 
0
--- 
2021 Q4
5
288 
0
--- 
2021 Q3
2
762 
0
--- 
2021 Q2
8
793 
0
--- 
2021 Q1
2
592 
1
936 
2020 Q4
6
226 
0
--- 
2020 Q3
1
576 
0
--- 
2020 Q2
2
620 
0
--- 
2020 Q1
2
694 
0
--- 
2019 Q4
3
297 
0
--- 
2019 Q3
1
245 
0
--- 
2019 Q2
5
482 
0
--- 
2019 Q1
3
673 
0
--- 
2018 Q3
5
809 
0
--- 
2018 Q1
2
518 
0
--- 
2017 Q3
1
305 
0
--- 
2017 Q2
3
800 
0
--- 
2016 Q3
3
747 
1
214 
2016 Q1
2
772 
0
--- 
2015 Q4
3
582 
0
--- 
2015 Q3
3
320 
0
--- 
2015 Q2
2
544 
0
--- 
2015 Q1
5
1 297 
0
--- 
2014 Q4
3
143 
0
--- 
2014 Q2
3
167 
0
--- 
2014 Q1
3
1 291 
0
--- 

Overview of the latest real estate transactions

The following list is an anonymized overview of the latest transactions. For more details and to find all transactions, please use the map to view transactions by plot or the transaction search page for a search by criteria.

2025-06-17
57 000 
523  /m²(109 m²)
Sale
Houses
House
5 rooms
109 m2
1 outbuilding
Land
210 m2
-Sols
2025-06-13
2 500 
Sale
Land
1400 m2
-Prés
Land
1155 m2
-Prés
2025-06-11
105 000 
938  /m²(112 m²)
Sale
Houses
House
4 rooms
112 m2
Land
368 m2
-Sols
Land
1045 m2
-Prés
2025-06-04
2 200 
Sale
Land
11014 m2
-Terres
2025-05-13
3 700 
Sale
Land
6050 m2
-Terres
Land
6933 m2
-Futaies résineuses
Land
6732 m2
-Prés
Land
3964 m2
-Futaies résineuses
2025-05-13
50 000 
980  /m²(51 m²)
Sale
Houses
House
2 rooms
51 m2
4 outbuildings
Land
768 m2
-Sols
2025-04-28
66 000 
1 535  /m²(43 m²)
Sale
Houses
House
3 rooms
43 m2
Land
500 m2
-Terres
Land
622 m2
-Sols
2025-04-11
75 000 
417  /m²(180 m²)
Sale
Apartments
Apartment
3 rooms
70 m2
Apartments
Apartment
2 rooms
55 m2
Apartments
Apartment
2 rooms
55 m2
Land
357 m2
-Sols
Land
45 m2
-Sols
Land
312 m2
-Jardins
2025-04-10
27 800 
232  /m²(120 m²)
Sale
Houses
House
4 rooms
120 m2
Land
655 m2
-Sols
Land
258 m2
-Taillis sous futaie
Land
332 m2
-Prés
Land
140 m2
-Landes
Land
229 m2
-Sols
2025-03-31
2 500 
Exchange
Land
8995 m2
-Terres
Land
1615 m2
-Terres
Land
11720 m2
-Prés
Land
4379 m2
-Prés
2025-03-26
30 000 
429  /m²(70 m²)
Sale
Houses
House
3 rooms
70 m2
Land
107 m2
-Sols
Land
213 m2
-Jardins
2025-03-10
20 000 
196  /m²(102 m²)
Sale
Houses
House
3 rooms
102 m2
Land
267 m2
-Sols
2025-03-07
31 000 
Sale
Land
14400 m2
-Bois
Land
4662 m2
-Bois
Land
1998 m2
-Futaies résineuses
Land
6795 m2
-Taillis sous futaie
Land
6795 m2
-Bois
Land
2420 m2
-Futaies résineuses
Land
2420 m2
-Bois
Land
2417 m2
-Bois
Land
2418 m2
-Futaies résineuses
2025-02-28
1 500 
Sale
Land
4400 m2
-Terres
Land
510 m2
-Jardins
2025-02-28
180 000 
265  /m²(680 m²)
Sale
Commercial property
680 m2
Land
2630 m2
-Sols
2025-02-04
72 093 
440  /m²(164 m²)
Sale
Apartments
Apartment
5 rooms
108 m2
Apartments
Apartment
2 rooms
56 m2
4 outbuildings
Land
590 m2
-Sols
Land
736 m2
-Jardins
2025-02-03
12 500 
Sale
Land
1439 m2
-Prés
Land
1130 m2
-Prés
2025-01-17
133 000 
1 031  /m²(129 m²)
Sale
Houses
House
6 rooms
129 m2
Land
820 m2
-Sols
2025-01-09
100 000 
256  /m²(390 m²)
455  /m²(220 m²)
Sale
Houses
House
8 rooms
220 m2
Commercial property
170 m2
Land
529 m2
-Sols
2025-01-09
70 000 
206  /m²(340 m²)
Sale
Commercial property
340 m2
Land
1536 m2
-Sols
379 transactions listed in the municipality

Puy-de-Dôme (63)

Most expensive cities

City
name
Descending orderHouses
house
Price per m²
3 348 
2 813 
2 755 
2 708 
2 658 
2 616 
2 602 
2 558 
City
name
Descending orderApartments
apt.
Price per m²
4 718 
2 935 
2 600 
2 591 
2 495 
2 472 
2 468 
2 388 

Least expensive cities

City
name
Ascending orderHouses
house
Price per m²
378 
412 
486 
492 
500 
506 
City
name
Ascending orderApartments
apt.
Price per m²
24 
113 
115 
123 
124