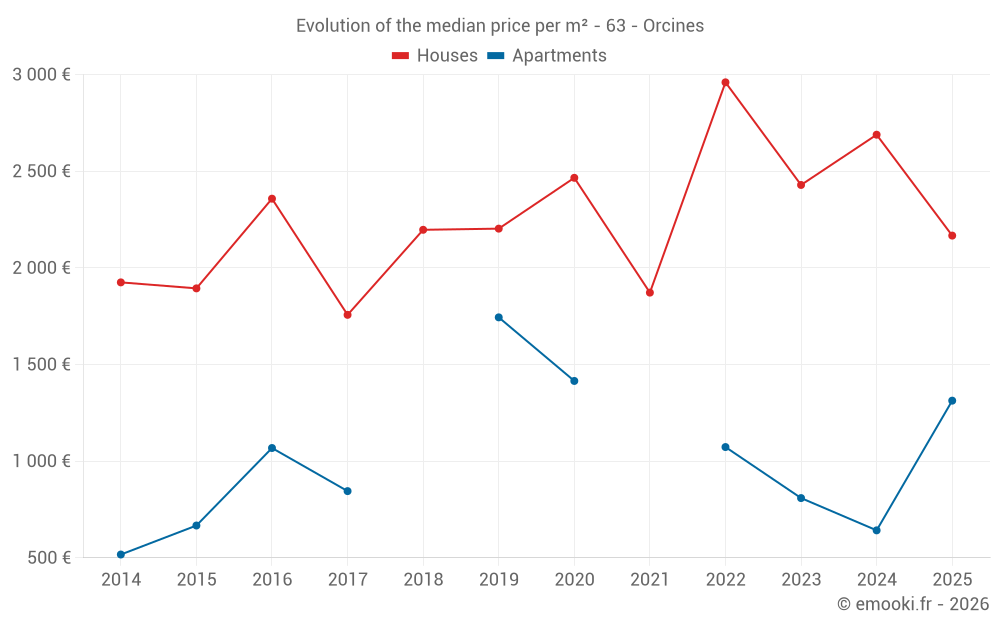
Median price of real estate
in the municipality of Orcines
Houses
2 339 € /m²
Reliability 8/10
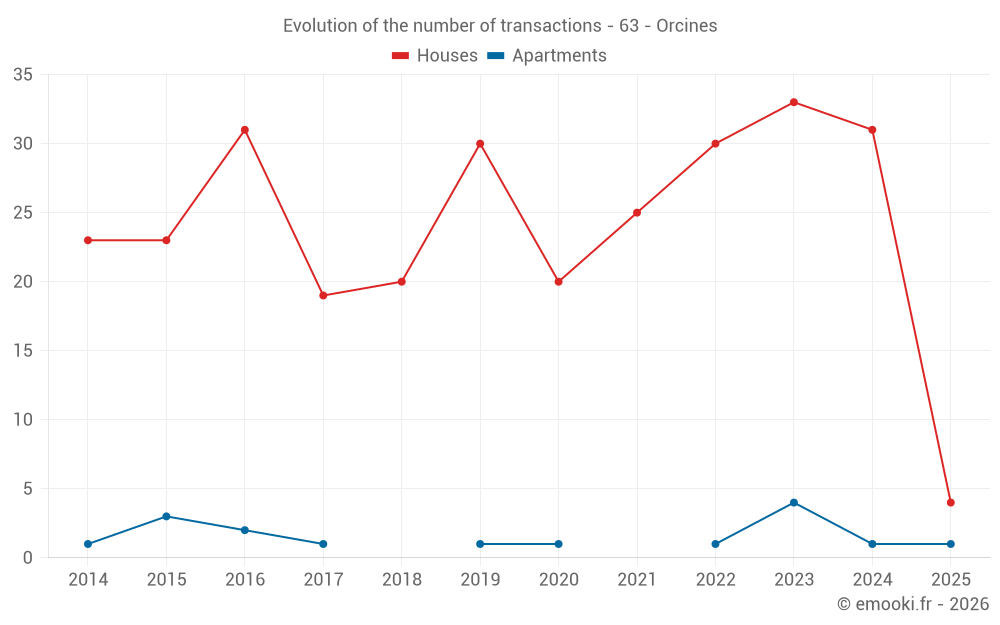
Median price on the 22 transactions of the last 12 months.
from 1 646 to
2 988 € /m²
2 988 € /m²
60% of transactions from the 2nd to the 8th deciles.
Apartments
1 193 € /m²
Reliability 3/10
Median price on the 8 transactions of the last 72 months.
Dwellings
2 108 € /m²
Reliability 8/10
Median price on the 24 transactions of the last 12 months.
from 1 275 to
2 966 € /m²
2 966 € /m²
60% of transactions from the 2nd to the 8th deciles.