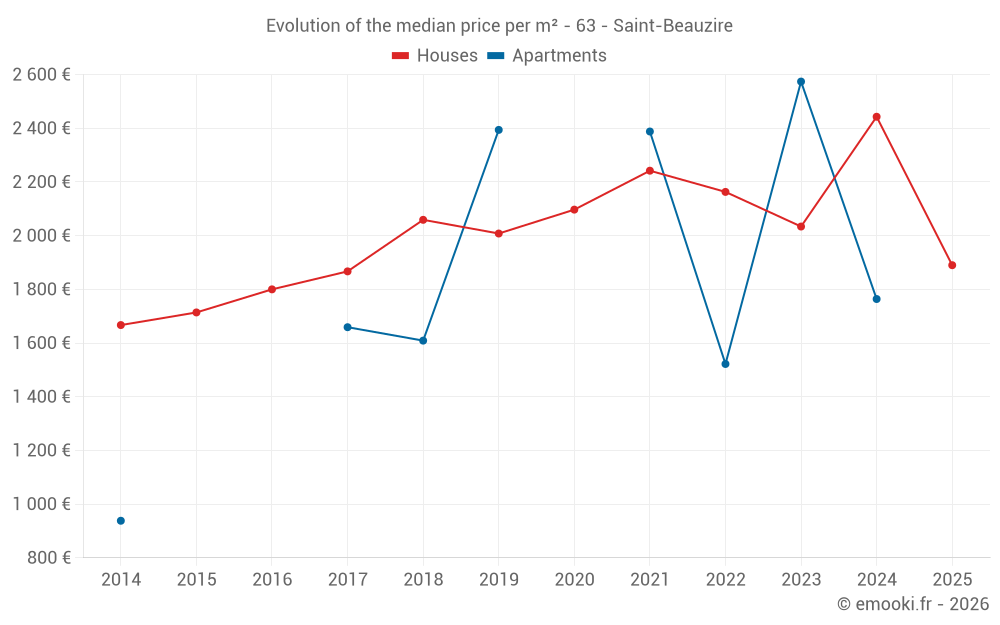
Median price of real estate
in the municipality of Saint-Beauzire
Houses
2 071 € /m²
Reliability 8/10
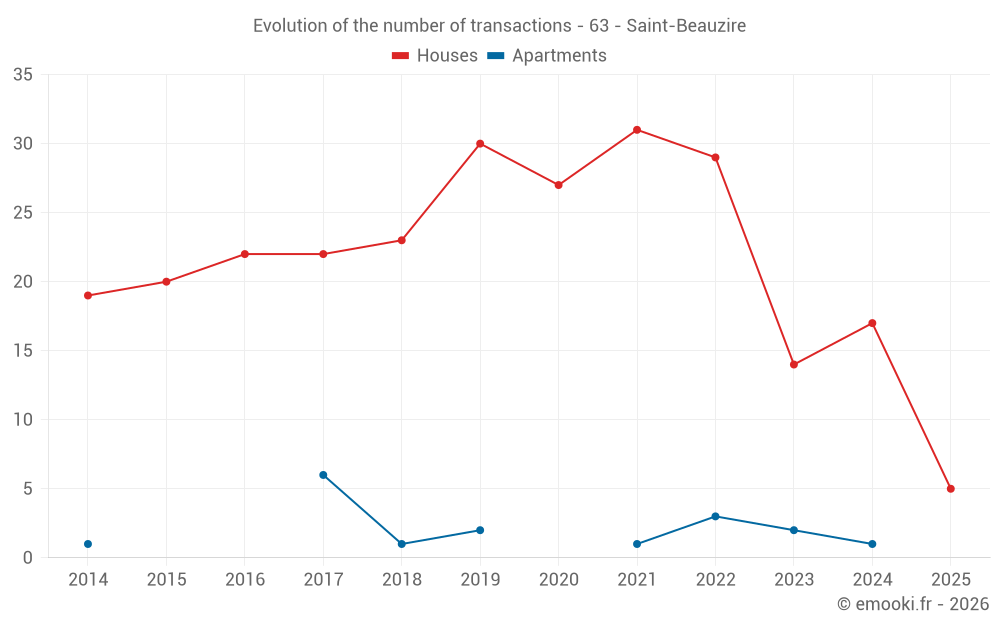
Median price on the 17 transactions of the last 12 months.
from 1 691 to
2 689 € /m²
2 689 € /m²
60% of transactions from the 2nd to the 8th deciles.
Apartments
2 388 € /m²
Reliability 3/10
Median price on the 9 transactions of the last 72 months.
Dwellings
2 071 € /m²
Reliability 8/10
Median price on the 17 transactions of the last 12 months.
from 1 691 to
2 689 € /m²
2 689 € /m²
60% of transactions from the 2nd to the 8th deciles.