emooki
HomePrice mapTransactions
🇬🇧 English🇫🇷 Français🇩🇪 Deutsch🇪🇸 Español🇮🇹 Italiano

Real estate price map


Real estate price map in the municipality of Durtol, choose a section to see transactions by parcel.

Puy-de-Dôme (63)

Durtol - Real estate price m²

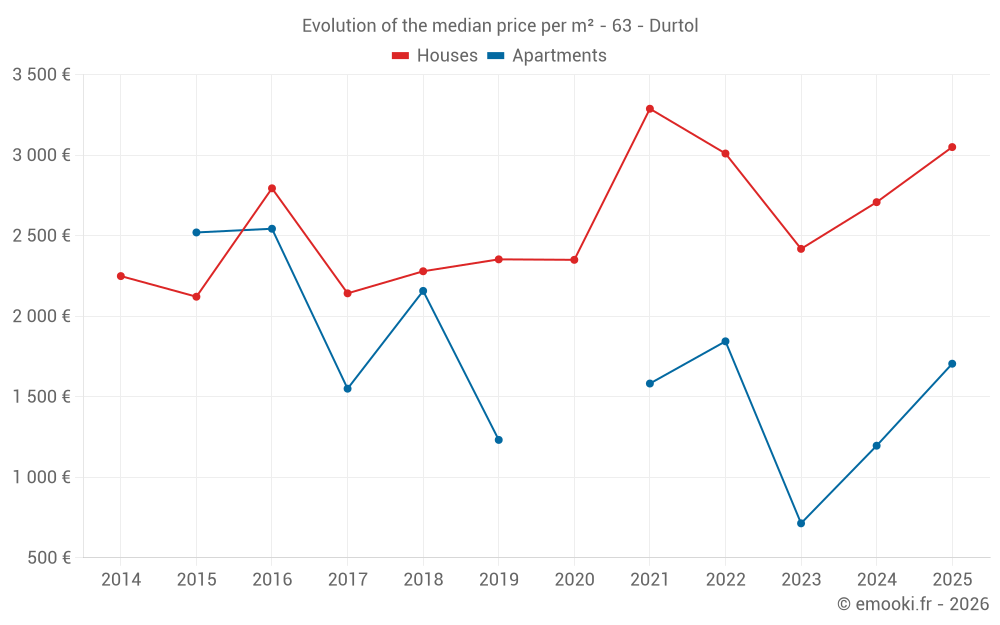
Median price of real estate
in the municipality of Durtol

HousesHouses
2 708  /m²
1-23-45-67-89-10
Reliability 7/10
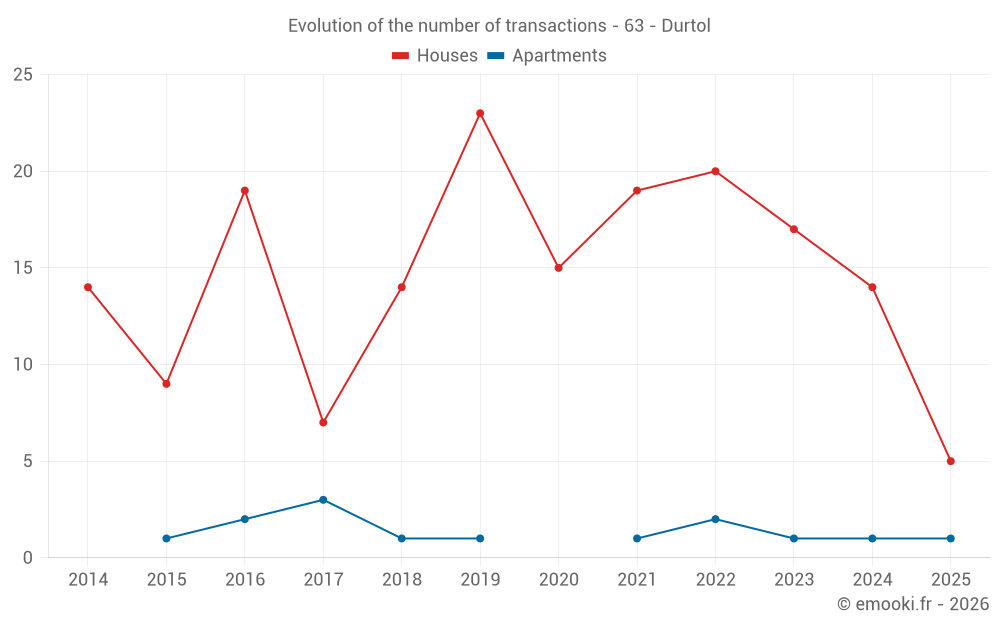
Median price on the 28 transactions of the last 24 months.
from 2 011 to
3 739  /m²
60% of transactions from the 2nd to the 8th deciles.
ApartmentsApartments
1 582  /m²
1-23-45-67-89-10
Reliability 3/10
Median price on the 7 transactions of the last 72 months.
DwellingsDwellings
2 424  /m²
1-23-45-67-89-10
Reliability 8/10
Median price on the 16 transactions of the last 12 months.
from 1 705 to
3 123  /m²
60% of transactions from the 2nd to the 8th deciles.
HousesEvolution of the price per m² of houses since...
1 year
+13%
2 years
+26%
3 years
+1.3%
4 years
-7.2%
5 years
+30%
6 years
+30%
7 years
+34%
8 years
+42%
9 years
+9.2%
10 years
+44%
11 years
+36%
The price per m² of houses has decreased by 7.2% since 4 years, but it has increased by 44% in 10 years.

Yearly evolution

Evolution of the median price per m²

Evolution of the median price per m² - 63 - Durtol

Evolution of the number of transactions

Warning, last year incomplete. Projections made based on the proportions between semesters of the previous year at the departmental/national level and by type of property.

Evolution of the number of transactions - 63 - Durtol

Yearly data

Descending order
Year
Houses
house
transactions
Houses
house
Price per m²
Apartments
apt.
transactions
Apartments
apt.
Price per m²
2025
5
3 050 
1
1 705 
2024
14
2 708 
1
1 196 
2023
17
2 418 
1
714 
2022
20
3 010 
2
1 844 
2021
19
3 288 
1
1 582 
2020
15
2 350 
0
--- 
2019
23
2 353 
1
1 232 
2018
14
2 279 
1
2 157 
2017
7
2 142 
3
1 550 
2016
19
2 794 
2
2 543 
2015
9
2 121 
1
2 520 
2014
14
2 249 
0
--- 

Analysis

Structure of prices per m²

Values of price percentiles per m² over the periods used for the estimated price of each type of property.

Structure of transaction amounts

Values of transaction amounts percentiles over the periods used for the estimated price of each type of property.

Transaction amounts and prices per m² by percentile

Ascending order
Percentile
Houses
house
Price per m²
Houses
house
Transaction amount
Apartments
apt.
Price per m²
Apartments
apt.
Transaction amount
10th percentile
1 304 
127 K
1 003 
90 365 
20th percentile
2 011 
185 K
1 203 
102 K
30th percentile
2 282 
226 K
1 225 
108 K
40th percentile
2 318 
310 K
1 372 
114 K
50th percentile
2 708 
329 K
1 582 
120 K
60th percentile
3 045 
352 K
1 598 
125 K
70th percentile
3 361 
402 K
1 627 
128 K
80th percentile
3 739 
445 K
1 686 
129 K
90th percentile
4 401 
489 K
1 855 
201 K

National and departmental comparison

Evolution of the median price per m² of houses

Evolution of the median price per m² of apartments

Quarterly evolution

Evolution of the median price per m²

Evolution of the number of transactions

Quarterly data

Descending order
Quarter
Houses
house
transactions
Houses
house
Price per m²
Apartments
apt.
transactions
Apartments
apt.
Price per m²
2025 Q2
1
2 309 
1
1 705 
2025 Q1
4
3 347 
0
--- 
2024 Q4
4
1 804 
0
--- 
2024 Q3
6
2 708 
0
--- 
2024 Q2
3
3 857 
0
--- 
2024 Q1
1
4 399 
1
1 196 
2023 Q4
5
2 012 
0
--- 
2023 Q3
4
3 018 
0
--- 
2023 Q2
4
3 304 
0
--- 
2023 Q1
4
2 439 
1
714 
2022 Q4
7
2 792 
0
--- 
2022 Q3
4
3 287 
1
2 081 
2022 Q2
4
2 075 
1
1 608 
2022 Q1
5
3 354 
0
--- 
2021 Q4
8
2 654 
0
--- 
2021 Q3
6
3 109 
1
1 582 
2021 Q2
4
2 366 
0
--- 
2021 Q1
1
3 835 
0
--- 
2020 Q4
5
2 350 
0
--- 
2020 Q3
6
2 635 
0
--- 
2020 Q2
3
2 531 
0
--- 
2020 Q1
1
1 831 
0
--- 
2019 Q4
9
2 442 
0
--- 
2019 Q3
2
2 206 
1
1 232 
2019 Q2
8
2 760 
0
--- 
2019 Q1
4
1 698 
0
--- 
2018 Q4
2
1 672 
1
2 157 
2018 Q3
7
2 714 
0
--- 
2018 Q2
2
1 890 
0
--- 
2018 Q1
3
2 150 
0
--- 
2017 Q4
1
2 656 
0
--- 
2017 Q3
3
2 136 
1
1 550 
2017 Q2
0
--- 
2
1 498 
2017 Q1
3
2 142 
0
--- 
2016 Q4
7
2 839 
0
--- 
2016 Q3
3
2 141 
0
--- 
2016 Q2
4
2 647 
1
2 689 
2016 Q1
5
2 818 
1
2 397 
2015 Q4
3
2 073 
1
2 520 
2015 Q3
5
2 852 
0
--- 
2015 Q1
1
1 690 
0
--- 
2014 Q4
4
1 492 
0
--- 
2014 Q3
2
2 249 
0
--- 
2014 Q2
5
2 372 
0
--- 
2014 Q1
3
2 449 
0
--- 

Overview of the latest real estate transactions

The following list is an anonymized overview of the latest transactions. For more details and to find all transactions, please use the map to view transactions by plot or the transaction search page for a search by criteria.

2025-06-16
127 850 
1 705  /m²(75 m²)
Sale
Apartments
Apartment
3 rooms
75 m2
1 outbuilding
2025-06-12
625 800 
2 309  /m²(271 m²)
Sale
Houses
House
8 rooms
271 m2
3 outbuildings
Land
1253 m2
-Sols
Land
10 m2
-Sols
Land
196 m2
-Sols
Land
386 m2
-Terrains d'agrément
2025-05-15
125 000 
Sale
Land
489 m2
-Sols
2025-04-17
3 000 
Sale
Land
2700 m2
-Pâtures
Land
1344 m2
-Terres
Land
445 m2
-Taillis sous futaie
Land
2020 m2
-Prés
Land
90 m2
-Taillis sous futaie
Land
160 m2
-Taillis sous futaie
Land
2610 m2
-Prés
Land
295 m2
-Taillis simples
Land
990 m2
-Pâtures
Land
500 m2
-Sols
Land
710 m2
-Jardins
2025-03-25
27 000 
600  /m²(45 m²)
Sale
Houses
House
45 m2
Land
51 m2
-Sols
2025-03-11
450 000 
6 923  /m²(65 m²)
Sale
Houses
House
5 rooms
65 m2
2 outbuildings
Land
1113 m2
-Sols
Land
900 m2
-Sols
Land
426 m2
-Futaies résineuses
Land
5 m2
-Sols
Land
221 m2
-Terres
2025-03-11
219 058 
Sale
Land
37 m2
-Jardins
/Jardin potager
Land
3 m2
-Jardins
/Jardin potager
Land
36 m2
-Jardins
/Jardin potager
Land
41 m2
-Jardins
/Jardin potager
Land
120 m2
-Terres
Land
2 m2
-Terres
Land
271 m2
-Terres
Land
157 m2
-Terres
2025-03-11
41 596 
Sale
Land
120 m2
-Jardins
/Jardin potager
Land
31 m2
-Jardins
/Jardin potager
Land
14 m2
-Terres
2025-02-14
347 700 
3 050  /m²(114 m²)
Sale
Land
126 m2
-Sols
Houses
House
6 rooms
114 m2
Land
232 m2
-Sols
Land
77 m2
-Sols
Land
45 m2
-Sols
2025-02-13
1 500 
Sale
Land
450 m2
-Landes
2025-01-15
437 225 
3 644  /m²(120 m²)
Sale
Houses
House
5 rooms
120 m2
Land
734 m2
-Sols
2024-12-31
145 400 
1 253  /m²(116 m²)
Sale
Land
49 m2
-Sols
Houses
House
5 rooms
116 m2
Land
88 m2
-Sols
2024-11-27
2 083 
Sale
Land
5950 m2
-Pâtures
2024-11-27
14 418 
Sale
Land
1430 m2
-Pâtures
Land
140 m2
-Landes
Land
2280 m2
-Prés
Land
4390 m2
-Terres
Land
1650 m2
-Prés
Land
3080 m2
-Taillis simples
Land
1090 m2
-Prés
Land
560 m2
-Pâtures
Land
560 m2
-Pâtures
Land
1140 m2
-Prés
2024-11-20
333 000 
2 281  /m²(146 m²)
Sale
Houses
House
5 rooms
146 m2
Land
731 m2
-Sols
2024-10-28
119 338 
1 326  /m²(90 m²)
Sale
Houses
House
6 rooms
90 m2
Land
1391 m2
-Sols
Land
1109 m2
-Jardins
Land
849 m2
-Pâtures
2024-10-10
500 
Sale
Land
104 m2
-Prés
2024-10-04
209 800 
2 528  /m²(83 m²)
Sale
Houses
House
3 rooms
83 m2
Land
186 m2
-Sols
Land
184 m2
-Sols
2024-09-27
325 500 
5 086  /m²(64 m²)
Sale
Houses
House
3 rooms
64 m2
2 outbuildings
Land
864 m2
-Jardins
Land
600 m2
-Sols
2024-09-19
171 500 
1 805  /m²(95 m²)
Sale
Houses
House
4 rooms
95 m2
Land
94 m2
-Sols
301 transactions listed in the municipality

Puy-de-Dôme (63)

Most expensive cities

City
name
Descending orderHouses
house
Price per m²
3 348 
2 813 
2 755 
2 708 
2 658 
2 616 
2 602 
2 558 
City
name
Descending orderApartments
apt.
Price per m²
4 718 
2 935 
2 600 
2 591 
2 495 
2 472 
2 468 
2 388 

Least expensive cities

City
name
Ascending orderHouses
house
Price per m²
378 
412 
486 
492 
500 
506 
City
name
Ascending orderApartments
apt.
Price per m²
24 
113 
115 
123 
124