Real estate price map
Real estate price map in the municipality of Arlanc, choose a section to see transactions by parcel.
Puy-de-Dôme (63)
Price per m² in Arlanc
Median price of real estate
in the municipality of Arlanc
Houses
864 € /m²
Reliability 8/10
Median price on the 24 transactions of the last 12 months.
from 455 to
1 434 € /m²
1 434 € /m²
60% of transactions from the 2nd to the 8th deciles.
Apartments
292 € /m²
Reliability 4/10
Median price on the 14 transactions of the last 60 months.
from 94 to
503 € /m²
503 € /m²
60% of transactions from the 2nd to the 8th deciles.
Dwellings
823 € /m²
Reliability 8/10
Median price on the 26 transactions of the last 12 months.
from 350 to
1 357 € /m²
1 357 € /m²
60% of transactions from the 2nd to the 8th deciles.
Evolution of the price per m² of houses since...
1 year
+99%
2 years
+163%
3 years
+20%
4 years
+18%
5 years
+31%
6 years
+44%
7 years
+24%
8 years
+40%
9 years
+27%
10 years
+137%
11 years
+111%
785 transactions listed in the municipality
Yearly data
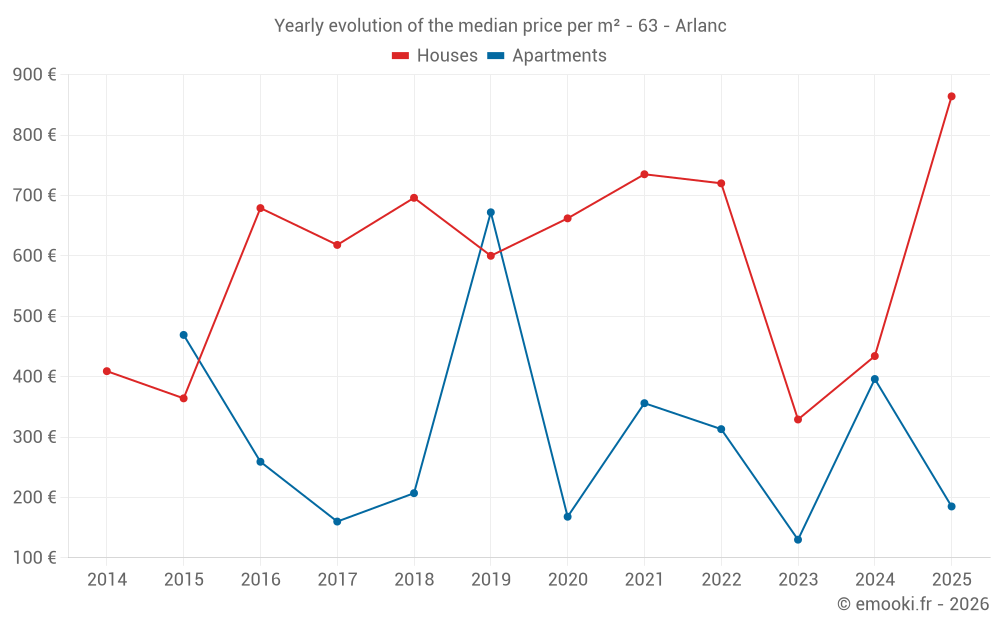
Yearly evolution of the median price per m²
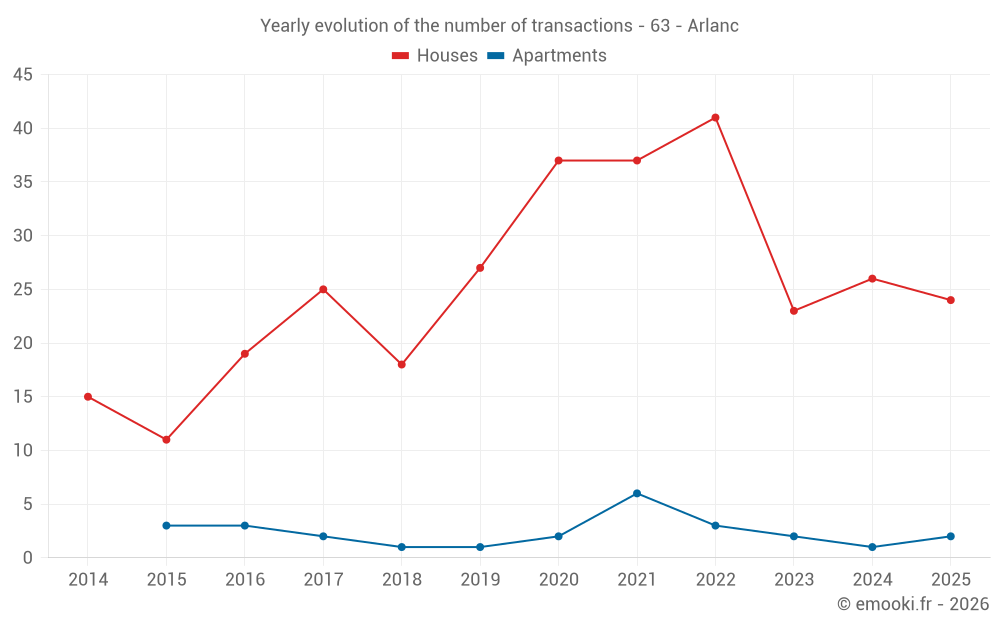
Yearly evolution of the number of transactions
Yearly table
Year
house
transactions
transactions
house
Price per m²
Price per m²
apt.
transactions
transactions
apt.
Price per m²
Price per m²
2025
24
864 €
2
185 €
2024
26
434 €
1
396 €
2023
23
329 €
2
130 €
2022
41
720 €
3
313 €
2021
37
735 €
6
356 €
2020
37
662 €
2
168 €
2019
27
600 €
1
672 €
2018
18
696 €
1
207 €
2017
25
618 €
2
160 €
2016
19
679 €
3
259 €
2015
11
364 €
3
469 €
2014
15
409 €
0
--- €
Analysis
Structure of prices per m²
Values of price percentiles per m² over the periods used for the estimated price of each type of property.
Structure of transaction amounts
Values of transaction amounts percentiles over the periods used for the estimated price of each type of property.
Transaction amounts and prices per m² by percentile
Percentile
house
Price per m²
Price per m²
house
Transaction amount
Transaction amount
apt.
Price per m²
Price per m²
apt.
Transaction amount
Transaction amount
10th percentile
268 €
20 850 €
50 €
16 000 €
20th percentile
455 €
33 400 €
94 €
27 200 €
30th percentile
660 €
43 650 €
147 €
31 800 €
40th percentile
744 €
55 400 €
212 €
35 900 €
50th percentile
864 €
75 650 €
292 €
43 500 €
60th percentile
1 042 €
86 600 €
343 €
49 500 €
70th percentile
1 312 €
105 K€
400 €
71 700 €
80th percentile
1 434 €
130 K€
503 €
93 000 €
90th percentile
1 761 €
156 K€
728 €
104 K€
National and departmental comparison
Evolution of the median price per m² of houses
Evolution of the median price per m² of apartments
Quarterly data
Quarterly evolution of the median price per m²
Quarterly evolution of the number of transactions
Quarterly table
Quarter
house
transactions
transactions
house
Price per m²
Price per m²
apt.
transactions
transactions
apt.
Price per m²
Price per m²
2025 Q4
6
992 €
0
--- €
2025 Q3
2
1 513 €
0
--- €
2025 Q2
6
910 €
0
--- €
2025 Q1
10
864 €
2
185 €
2024 Q4
4
550 €
0
--- €
2024 Q3
6
780 €
1
396 €
2024 Q2
6
570 €
0
--- €
2024 Q1
10
244 €
0
--- €
2023 Q4
4
634 €
1
109 €
2023 Q3
6
226 €
0
--- €
2023 Q2
10
514 €
0
--- €
2023 Q1
3
385 €
1
151 €
2022 Q4
12
1 032 €
2
620 €
2022 Q3
9
575 €
1
41 €
2022 Q2
12
724 €
0
--- €
2022 Q1
8
594 €
0
--- €
2021 Q4
7
611 €
1
271 €
2021 Q3
15
611 €
2
256 €
2021 Q2
6
624 €
2
490 €
2021 Q1
9
918 €
1
597 €
2020 Q4
12
924 €
0
--- €
2020 Q3
13
643 €
1
90 €
2020 Q2
7
662 €
1
247 €
2020 Q1
5
605 €
0
--- €
2019 Q4
11
838 €
0
--- €
2019 Q3
9
606 €
1
672 €
2019 Q2
2
471 €
0
--- €
2019 Q1
5
427 €
0
--- €
2018 Q4
7
710 €
0
--- €
2018 Q3
4
787 €
0
--- €
2018 Q2
6
590 €
0
--- €
2018 Q1
1
500 €
1
207 €
2017 Q4
6
750 €
0
--- €
2017 Q3
6
490 €
0
--- €
2017 Q2
9
650 €
1
75 €
2017 Q1
4
444 €
1
246 €
2016 Q4
6
286 €
1
468 €
2016 Q3
2
967 €
2
216 €
2016 Q2
7
1 250 €
0
--- €
2016 Q1
4
1 286 €
0
--- €
2015 Q4
2
494 €
0
--- €
2015 Q3
6
341 €
3
469 €
2015 Q2
1
267 €
0
--- €
2015 Q1
2
1 459 €
0
--- €
2014 Q4
6
404 €
0
--- €
2014 Q3
4
566 €
0
--- €
2014 Q2
1
1 038 €
0
--- €
2014 Q1
4
150 €
0
--- €
Key takeaways
What is the price per m2 of houses in Arlanc?
The median price on the 24 house transactions of the last 12 months in the municipality of Arlanc was 864 € per square meter for a median property value of 75 650 €. Over this period, 60% of transactions were between 455 and 1 434 € per square meter (from the 2nd to the 8th deciles).
Compare with neighboring municipalities
City
name
name
house
Price per m²
Price per m²
apt.
Price per m²
Price per m²
City information
Zip code
- 63220 ARLANC