emooki
HomePrice mapTransactions
🇬🇧 English🇫🇷 Français🇩🇪 Deutsch🇪🇸 Español🇮🇹 Italiano

Real estate price map


Real estate price map in the municipality of Saint-Jean-de-Losne, choose a section to see transactions by parcel.

Côte-d'Or (21)

Saint-Jean-de-Losne - Real estate price m²

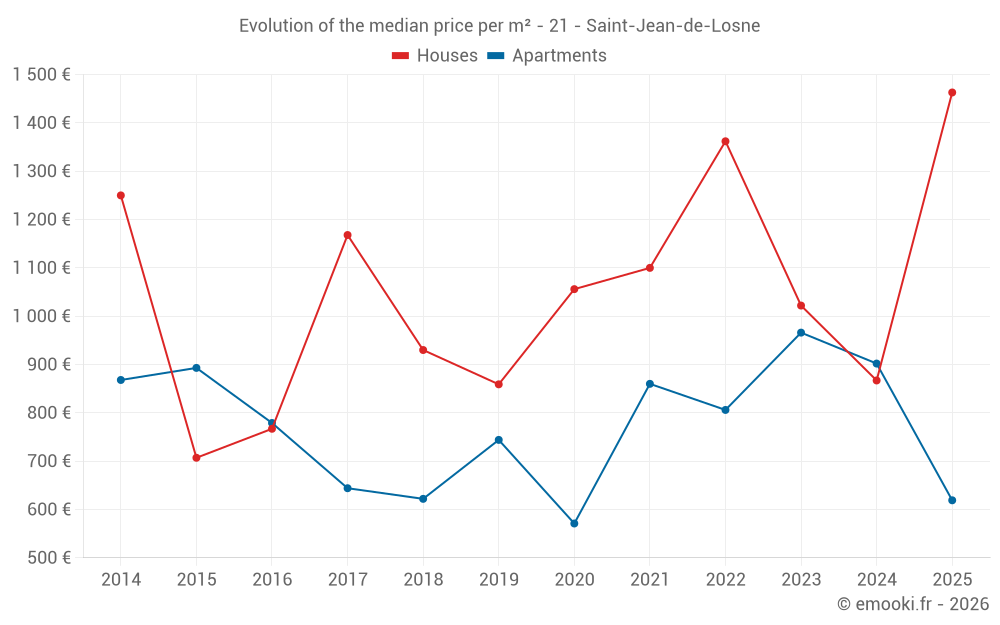
Median price of real estate
in the municipality of Saint-Jean-de-Losne

HousesHouses
1 066  /m²
1-23-45-67-89-10
Reliability 6/10
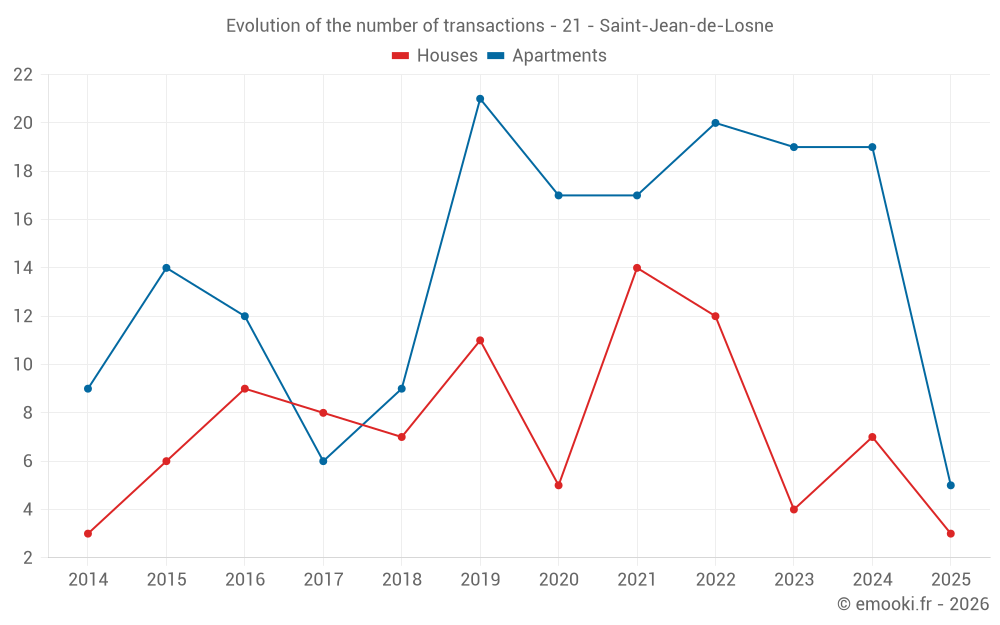
Median price on the 20 transactions of the last 36 months.
from 864 to
1 477  /m²
60% of transactions from the 2nd to the 8th deciles.
ApartmentsApartments
842  /m²
1-23-45-67-89-10
Reliability 7/10
Median price on the 32 transactions of the last 24 months.
from 625 to
1 179  /m²
60% of transactions from the 2nd to the 8th deciles.
DwellingsDwellings
1 050  /m²
1-23-45-67-89-10
Reliability 8/10
Median price on the 20 transactions of the last 12 months.
from 616 to
1 470  /m²
60% of transactions from the 2nd to the 8th deciles.
ApartmentsEvolution of the price per m² of apartments since...
1 year
-31%
2 years
-36%
3 years
-23%
4 years
-28%
5 years
+8.4%
6 years
-17%
7 years
-0.5%
8 years
-3.9%
9 years
-21%
10 years
-31%
11 years
-29%
The price per m² of apartments has decreased by 36% since 2 years, but it has increased by 8.4% in 5 years.

Yearly evolution

Evolution of the median price per m²

Evolution of the median price per m² - 21 - Saint-Jean-de-Losne

Evolution of the number of transactions

Warning, last year incomplete. Projections made based on the proportions between semesters of the previous year at the departmental/national level and by type of property.

Evolution of the number of transactions - 21 - Saint-Jean-de-Losne

Yearly data

Descending order
Year
Houses
house
transactions
Houses
house
Price per m²
Apartments
apt.
transactions
Apartments
apt.
Price per m²
2025
3
1 463 
5
619 
2024
7
867 
19
902 
2023
4
1 022 
19
966 
2022
12
1 362 
20
806 
2021
14
1 100 
17
860 
2020
5
1 056 
17
571 
2019
11
859 
21
744 
2018
7
930 
9
622 
2017
8
1 168 
6
644 
2016
9
767 
12
779 
2015
6
707 
14
893 
2014
3
1 250 
9
868 

Analysis

Structure of prices per m²

Values of price percentiles per m² over the periods used for the estimated price of each type of property.

Structure of transaction amounts

Values of transaction amounts percentiles over the periods used for the estimated price of each type of property.

Transaction amounts and prices per m² by percentile

Ascending order
Percentile
Houses
house
Price per m²
Houses
house
Transaction amount
Apartments
apt.
Price per m²
Apartments
apt.
Transaction amount
10th percentile
693 
59 500 
436 
35 000 
20th percentile
864 
64 220 
625 
39 200 
30th percentile
948 
74 580 
681 
45 300 
40th percentile
1 012 
84 800 
754 
53 200 
50th percentile
1 066 
102 K
842 
59 250 
60th percentile
1 277 
117 K
956 
64 000 
70th percentile
1 366 
138 K
1 112 
71 940 
80th percentile
1 477 
155 K
1 179 
75 000 
90th percentile
1 607 
210 K
1 360 
98 200 

National and departmental comparison

Evolution of the median price per m² of houses

Evolution of the median price per m² of apartments

Quarterly evolution

Evolution of the median price per m²

Evolution of the number of transactions

Quarterly data

Descending order
Quarter
Houses
house
transactions
Houses
house
Price per m²
Apartments
apt.
transactions
Apartments
apt.
Price per m²
2025 Q2
1
1 000 
0
--- 
2025 Q1
2
1 497 
5
619 
2024 Q4
2
1 062 
5
1 136 
2024 Q3
1
1 808 
4
850 
2024 Q2
2
959 
5
852 
2024 Q1
2
772 
5
833 
2023 Q4
1
1 222 
4
568 
2023 Q3
2
1 022 
4
1 218 
2023 Q2
1
914 
5
1 037 
2023 Q1
0
--- 
6
791 
2022 Q4
4
1 366 
6
750 
2022 Q3
2
1 024 
8
584 
2022 Q2
4
1 300 
2
974 
2022 Q1
2
1 172 
4
855 
2021 Q4
2
1 226 
5
1 032 
2021 Q3
4
1 242 
9
777 
2021 Q2
6
1 100 
1
909 
2021 Q1
2
887 
2
1 022 
2020 Q4
1
1 444 
8
510 
2020 Q3
1
1 429 
5
720 
2020 Q2
1
310 
1
1 344 
2020 Q1
2
898 
3
1 100 
2019 Q4
0
--- 
7
688 
2019 Q3
7
905 
7
761 
2019 Q2
2
757 
5
540 
2019 Q1
2
994 
2
894 
2018 Q4
2
921 
1
294 
2018 Q3
2
1 038 
2
450 
2018 Q2
2
660 
5
839 
2018 Q1
1
510 
1
622 
2017 Q4
5
1 182 
1
1 271 
2017 Q2
0
--- 
1
749 
2017 Q1
3
1 154 
4
520 
2016 Q4
4
1 324 
5
825 
2016 Q3
2
704 
4
862 
2016 Q2
3
346 
3
733 
2015 Q4
2
1 354 
2
824 
2015 Q3
4
707 
3
808 
2015 Q2
0
--- 
7
1 119 
2015 Q1
0
--- 
2
492 
2014 Q3
2
1 150 
0
--- 
2014 Q2
0
--- 
1
667 
2014 Q1
1
1 250 
8
910 

Overview of the latest real estate transactions

The following list is an anonymized overview of the latest transactions. For more details and to find all transactions, please use the map to view transactions by plot or the transaction search page for a search by criteria.

2025-06-06
110 000 
1 000  /m²(110 m²)
Sale
Houses
House
4 rooms
110 m2
2 outbuildings
Land
61 m2
-Sols
Land
114 m2
-Sols
Land
233 m2
-Sols
2025-04-18
22 000 
344  /m²(64 m²)
Sale
Commercial property
64 m2
2025-04-14
1 
Sale
Land
297 m2
-Landes
Land
211 m2
-Landes
Land
10 m2
-Landes
Land
137 m2
-Sols
Land
255 m2
-Sols
2025-04-14
1 
Sale
Land
1 m2
-Sols
Land
42 m2
-Sols
2025-03-31
150 000 
1 531  /m²(98 m²)
Sale
Houses
House
3 rooms
98 m2
Land
140 m2
-Sols
2025-03-31
100 000 
515  /m²(194 m²)
746  /m²(134 m²)
Sale
Apartments
Apartment
3 rooms
70 m2
Apartments
Apartment
3 rooms
64 m2
Commercial property
60 m2
Land
113 m2
-Sols
2025-03-28
6 500 
Sale
1 outbuilding
2025-03-28
38 000 
603  /m²(63 m²)
Sale
Apartments
Apartment
3 rooms
63 m2
1 outbuilding
2025-03-25
130 000 
1 040  /m²(125 m²)
2 063  /m²(63 m²)
Sale
Apartments
Apartment
3 rooms
63 m2
Commercial property
62 m2
1 outbuilding
2025-03-24
110 000 
372  /m²(296 m²)
Sale
Commercial property
208 m2
Commercial property
88 m2
2025-03-17
9 000 
Sale
1 outbuilding
2025-03-03
39 000 
619  /m²(63 m²)
Sale
Apartments
Apartment
3 rooms
63 m2
1 outbuilding
2025-03-03
10 500 
Sale
1 outbuilding
2025-02-19
75 000 
1 364  /m²(55 m²)
Sale
Apartments
Apartment
3 rooms
55 m2
2 outbuildings
2025-01-10
30 000 
236  /m²(127 m²)
Sale
Apartments
Apartment
3 rooms
80 m2
Apartments
Apartment
1 room
47 m2
2 outbuildings
2025-01-06
60 000 
1 463  /m²(41 m²)
Sale
Houses
House
3 rooms
41 m2
Land
42 m2
-Sols
2025-01-02
53 500 
637  /m²(84 m²)
Sale
Apartments
Apartment
4 rooms
84 m2
2 outbuildings
2024-12-20
65 000 
406  /m²(160 m²)
Sale
Apartments
Apartment
5 rooms
113 m2
Apartments
Apartment
1 room
47 m2
1 outbuilding
2024-12-19
1 0
Sale
Commercial property
50 m2
Commercial property
437 m2
Commercial property
248 m2
Land
313 m2
-Sols
2024-12-04
214 000 
1 585  /m²(135 m²)
Sale
Houses
House
8 rooms
135 m2
1 outbuilding
Land
680 m2
-Sols
Land
281 m2
-Terrains d'agrément
360 transactions listed in the municipality

Côte-d'Or (21)

Most expensive cities

City
name
Descending orderHouses
house
Price per m²
3 333 
3 264 
3 218 
3 137 
3 105 
3 047 
3 030 
City
name
Descending orderApartments
apt.
Price per m²
3 394 
3 012 
2 886 
2 846 

Least expensive cities

City
name
Ascending orderHouses
house
Price per m²
210 
225 
250 
274 
287 
287 
357 
City
name
Ascending orderApartments
apt.
Price per m²
58 
65 
74 
79 
112