emooki
HomePrice mapTransactions
🇬🇧 English🇫🇷 Français🇩🇪 Deutsch🇪🇸 Español🇮🇹 Italiano

Real estate price map


Real estate price map in the municipality of Hauteville-lès-Dijon, choose a section to see transactions by parcel.

Côte-d'Or (21)
Hauteville-lès-Dijon

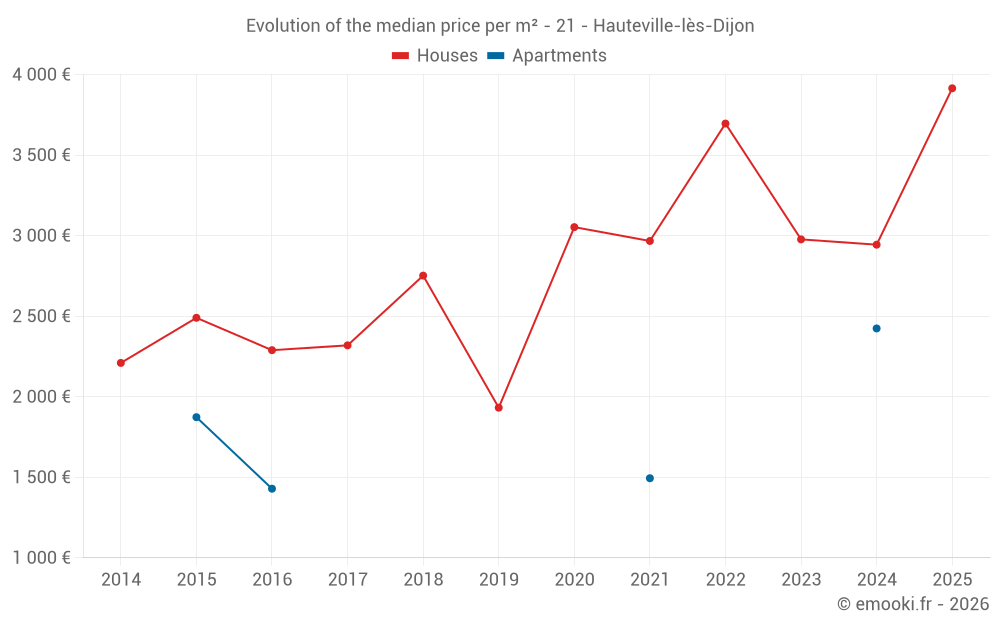
Median price of real estate
in the municipality of Hauteville-lès-Dijon

HousesHouses
3 202  /m²
1-23-45-67-89-10
Reliability 6/10
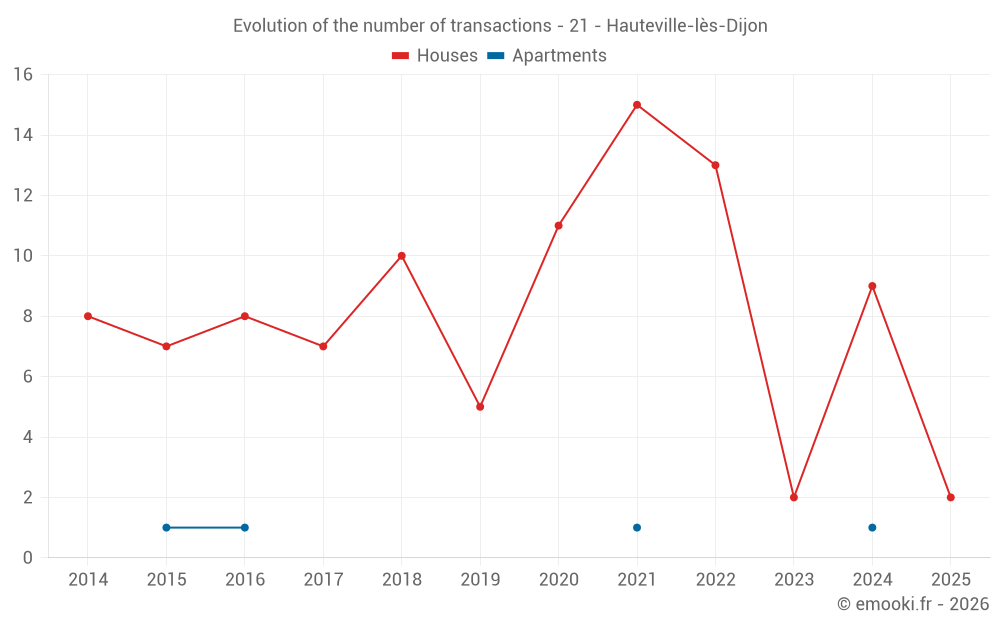
Median price on the 21 transactions of the last 36 months.
from 2 785 to
3 843  /m²
60% of transactions from the 2nd to the 8th deciles.
ApartmentsApartments
1 494  /m²
1-23-45-67-89-10
Reliability 1/10
Median price on the 3 transactions of the last 120 months.
DwellingsDwellings
3 096  /m²
1-23-45-67-89-10
Reliability 6/10
Median price on the 22 transactions of the last 36 months.
from 2 783 to
3 789  /m²
60% of transactions from the 2nd to the 8th deciles.

Yearly evolution

Evolution of the median price per m²

Evolution of the number of transactions

Warning, last year incomplete. Projections made based on the proportions between semesters of the previous year at the departmental/national level and by type of property.

Yearly data

Descending order
Year
Houses
house
transactions
Houses
house
Price per m²
Apartments
apt.
transactions
Apartments
apt.
Price per m²
2025
2
3 915 
0
--- 
2024
9
2 944 
1
2 424 
2023
2
2 977 
0
--- 
2022
13
3 696 
0
--- 
2021
15
2 967 
1
1 494 
2020
11
3 053 
0
--- 
2019
5
1 932 
0
--- 
2018
10
2 752 
0
--- 
2017
7
2 319 
0
--- 
2016
8
2 289 
1
1 429 
2015
7
2 490 
1
1 873 
2014
8
2 210 
0
--- 

Analysis

Structure of prices per m²

Values of price percentiles per m² over the periods used for the estimated price of each type of property.

Structure of transaction amounts

Values of transaction amounts percentiles over the periods used for the estimated price of each type of property.

Transaction amounts and prices per m² by percentile

Ascending order
Percentile
Houses
house
Price per m²
Houses
house
Transaction amount
Apartments
apt.
Price per m²
Apartments
apt.
Transaction amount
10th percentile
2 752 
265 K
1 442 
121 K
20th percentile
2 785 
280 K
1 455 
126 K
30th percentile
2 944 
409 K
1 468 
132 K
40th percentile
2 970 
420 K
1 481 
137 K
50th percentile
3 202 
435 K
1 494 
143 K
60th percentile
3 362 
465 K
1 680 
185 K
70th percentile
3 557 
480 K
1 866 
227 K
80th percentile
3 843 
504 K
2 052 
269 K
90th percentile
4 217 
596 K
2 238 
311 K

National and departmental comparison

Evolution of the median price per m² of houses

Evolution of the median price per m² of apartments

Quarterly evolution

Evolution of the median price per m²

Evolution of the number of transactions

Quarterly data

Descending order
Quarter
Houses
house
transactions
Houses
house
Price per m²
Apartments
apt.
transactions
Apartments
apt.
Price per m²
2025 Q1
2
3 915 
0
--- 
2024 Q4
1
2 782 
1
2 424 
2024 Q3
2
2 896 
0
--- 
2024 Q2
1
907 
0
--- 
2024 Q1
5
3 221 
0
--- 
2023 Q3
1
2 752 
0
--- 
2023 Q1
1
3 202 
0
--- 
2022 Q4
3
3 557 
0
--- 
2022 Q3
5
3 843 
0
--- 
2022 Q1
5
3 696 
0
--- 
2021 Q4
5
2 726 
0
--- 
2021 Q3
5
3 448 
1
1 494 
2021 Q2
3
2 388 
0
--- 
2021 Q1
2
2 857 
0
--- 
2020 Q4
4
3 270 
0
--- 
2020 Q3
3
2 273 
0
--- 
2020 Q2
3
3 053 
0
--- 
2020 Q1
1
2 926 
0
--- 
2019 Q4
2
1 540 
0
--- 
2019 Q3
1
2 619 
0
--- 
2019 Q2
1
2 982 
0
--- 
2019 Q1
1
1 733 
0
--- 
2018 Q4
3
2 848 
0
--- 
2018 Q3
2
2 068 
0
--- 
2018 Q2
3
3 211 
0
--- 
2018 Q1
2
2 158 
0
--- 
2017 Q4
2
2 064 
0
--- 
2017 Q3
3
2 319 
0
--- 
2017 Q2
1
2 451 
0
--- 
2017 Q1
1
1 780 
0
--- 
2016 Q4
1
2 349 
0
--- 
2016 Q3
2
2 328 
0
--- 
2016 Q2
3
1 895 
0
--- 
2016 Q1
2
2 784 
1
1 429 
2015 Q4
3
2 490 
0
--- 
2015 Q3
2
2 876 
0
--- 
2015 Q2
1
2 476 
0
--- 
2015 Q1
1
1 104 
1
1 873 
2014 Q4
4
2 114 
0
--- 
2014 Q3
1
2 154 
0
--- 
2014 Q1
3
3 030 
0
--- 

Overview of the latest real estate transactions

The following list is an anonymized overview of the latest transactions. For more details and to find all transactions, please use the map to view transactions by plot or the transaction search page for a search by criteria.

2025-04-28
4 500 
Sale
Land
780 m2
-Terres
Land
2020 m2
-Vignes
2025-03-12
24 600 
Sale
Land
41860 m2
-Terres
Land
2600 m2
-Landes
/Patis
Land
9540 m2
-Terres
2025-02-28
90 000 
Sale
Land
228 m2
-Terrains à bâtir
2025-02-21
142 000 
Sale
Land
378 m2
-Terrains à bâtir
2025-02-17
420 000 
4 468  /m²(94 m²)
Sale
Houses
House
5 rooms
94 m2
1 outbuilding
Land
860 m2
-Sols
2025-01-06
487 500 
3 362  /m²(145 m²)
Sale
Houses
House
6 rooms
145 m2
Land
1514 m2
-Sols
2024-12-30
90 000 
transaction.nature.Vente terrain à bâtir
Land
189 m2
-Terrains à bâtir
Land
67 m2
-Terrains à bâtir
2024-12-27
90 000 
Sale
Land
230 m2
-Terrains à bâtir
2024-12-22
208 641 
2 782  /m²(75 m²)
Sale
Houses
House
4 rooms
75 m2
Land
210 m2
-Sols
2024-12-12
2 774 
Sale
Land
6180 m2
-Terres
Land
1737 m2
-Terres
Land
1260 m2
-Terres
Land
1361 m2
-Terres
Land
800 m2
-Terres
Land
920 m2
-Terres
Land
3725 m2
-Terres
2024-11-08
143 000 
2 424  /m²(59 m²)
Sale
Apartments
Apartment
3 rooms
59 m2
1 outbuilding
2024-09-27
265 000 
2 944  /m²(90 m²)
Sale
Houses
House
4 rooms
90 m2
Land
1087 m2
-Sols
2024-09-18
430 000 
2 848  /m²(151 m²)
Sale
Houses
House
7 rooms
151 m2
Land
633 m2
-Sols
Land
123 m2
-Sols
2024-09-17
13 295 
Sale
Land
6640 m2
-Terres
Land
956 m2
-Vergers
/Cassis
Land
5160 m2
-Terres
Land
3720 m2
-Terres
Land
3800 m2
-Terres
Land
24040 m2
-Terres
2024-09-17
9 082 
Sale
Land
14182 m2
-Terres
Land
16090 m2
-Terres
2024-06-28
112 500 
907  /m²(124 m²)
Sale
Houses
House
5 rooms
124 m2
1 outbuilding
Land
220 m2
-Sols
Land
282 m2
-Sols
Land
242 m2
-Sols
2024-05-03
1 
Sale
Land
609 m2
-Terres
Land
702 m2
-Terres
Land
572 m2
-Terres
2024-03-22
702 000 
3 458  /m²(203 m²)
Sale
Land
1460 m2
-Terrains d'agrément
Houses
House
8 rooms
203 m2
2 outbuildings
Land
1973 m2
-Jardins
Land
300 m2
-Sols
Land
623 m2
-Sols
Land
153 m2
-Terres
Land
141 m2
-Terres
Land
143 m2
-Terres
2024-03-18
41 724 
Sale
Land
3 m2
-Terres
Land
534 m2
-Terres
Land
702 m2
-Terres
2024-03-12
1 285 669 
Sale
Land
879 m2
-Terres
Land
375 m2
-Terres
Land
278 m2
-Terres
Land
357 m2
-Terres
Land
566 m2
-Terres
Land
566 m2
-Terres
Land
566 m2
-Terres
Land
566 m2
-Terres
Land
561 m2
-Terres
Land
6 m2
-Terres
Land
3908 m2
-Terres
Land
228 m2
-Terres
Land
230 m2
-Terres
Land
231 m2
-Terres
Land
282 m2
-Terres
Land
501 m2
-Terres
Land
615 m2
-Terres
Land
525 m2
-Terres
Land
520 m2
-Terres
Land
590 m2
-Terres
Land
516 m2
-Terres
Land
501 m2
-Terres
Land
599 m2
-Terres
Land
528 m2
-Terres
Land
582 m2
-Terres
Land
21 m2
-Terres
Land
64 m2
-Terres
Land
839 m2
-Terres
Land
609 m2
-Terres

Côte-d'Or (21)

Most expensive cities

City
name
Descending orderHouses
house
Price per m²
3 333 
3 264 
3 218 
3 137 
3 105 
3 047 
3 030 
City
name
Descending orderApartments
apt.
Price per m²
3 394 
3 012 
2 886 
2 846 

Least expensive cities

City
name
Ascending orderHouses
house
Price per m²
210 
225 
250 
274 
287 
287 
357 
City
name
Ascending orderApartments
apt.
Price per m²
58 
65 
74 
79 
112