emooki
HomePrice mapTransactions
🇬🇧 English🇫🇷 Français🇩🇪 Deutsch🇪🇸 Español🇮🇹 Italiano

Real estate price map


Real estate price map in the municipality of Brazey-en-Plaine, choose a section to see transactions by parcel.

Côte-d'Or (21)

Brazey-en-Plaine - Real estate price m²

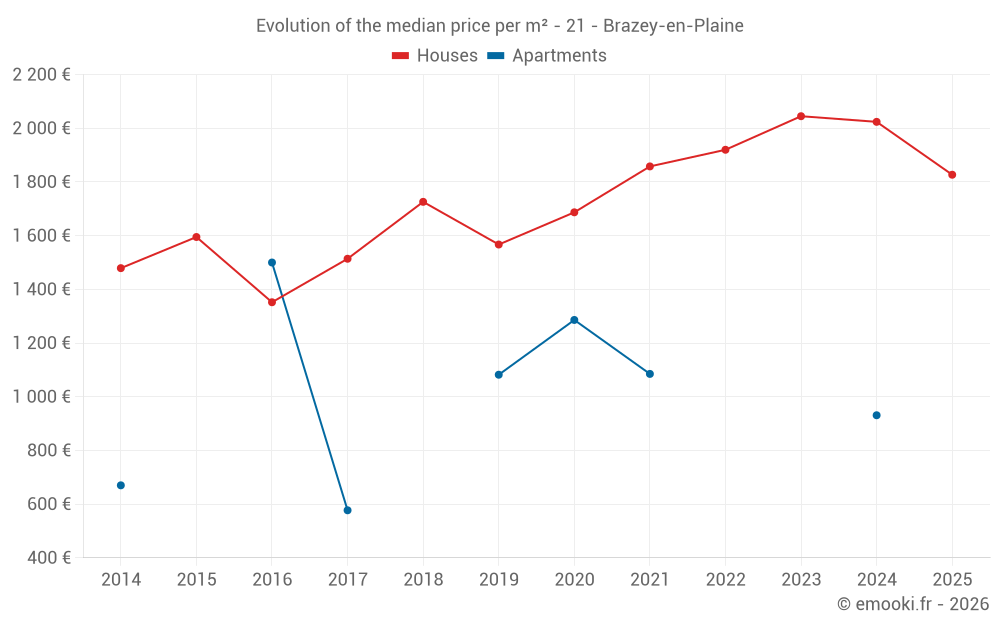
Median price of real estate
in the municipality of Brazey-en-Plaine

HousesHouses
1 980  /m²
1-23-45-67-89-10
Reliability 8/10
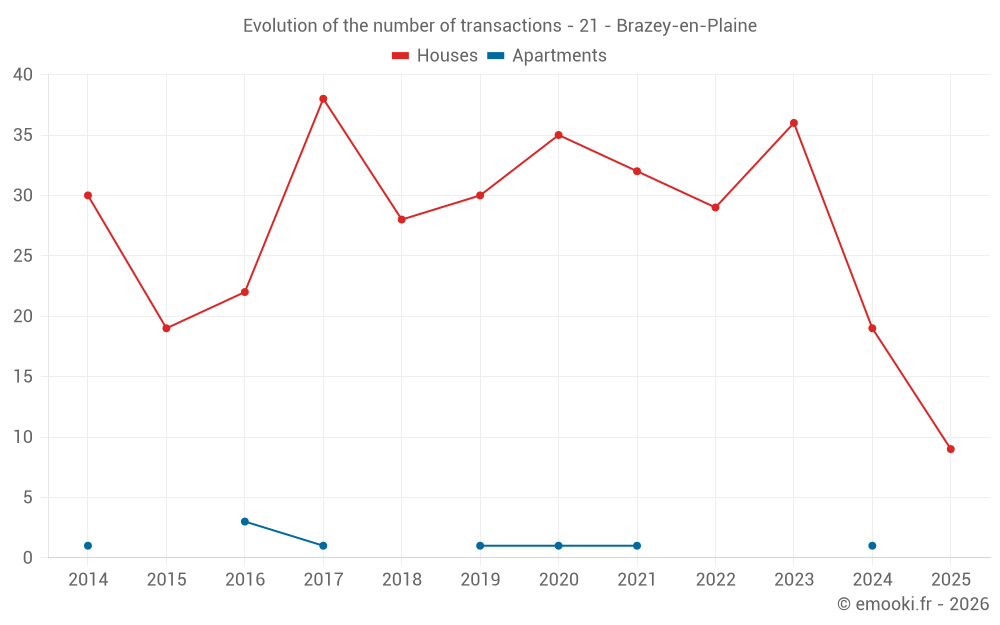
Median price on the 20 transactions of the last 12 months.
from 1 604 to
2 170  /m²
60% of transactions from the 2nd to the 8th deciles.
ApartmentsApartments
1 082  /m²
1-23-45-67-89-10
Reliability 2/10
Median price on the 5 transactions of the last 96 months.
DwellingsDwellings
1 936  /m²
1-23-45-67-89-10
Reliability 8/10
Median price on the 21 transactions of the last 12 months.
from 1 479 to
2 168  /m²
60% of transactions from the 2nd to the 8th deciles.
HousesEvolution of the price per m² of houses since...
1 year
-10%
2 years
-11%
3 years
-4.8%
4 years
-1.7%
5 years
+8.3%
6 years
+17%
7 years
+5.9%
8 years
+21%
9 years
+35%
10 years
+15%
11 years
+24%
The price per m² of houses has decreased by 11% since 2 years, but it has increased by 35% in 9 years.

Yearly evolution

Evolution of the median price per m²

Evolution of the median price per m² - 21 - Brazey-en-Plaine

Evolution of the number of transactions

Warning, last year incomplete. Projections made based on the proportions between semesters of the previous year at the departmental/national level and by type of property.

Evolution of the number of transactions - 21 - Brazey-en-Plaine

Yearly data

Descending order
Year
Houses
house
transactions
Houses
house
Price per m²
Apartments
apt.
transactions
Apartments
apt.
Price per m²
2025
9
1 827 
0
--- 
2024
19
2 024 
1
931 
2023
36
2 045 
0
--- 
2022
29
1 920 
0
--- 
2021
32
1 858 
1
1 085 
2020
35
1 687 
1
1 286 
2019
30
1 567 
1
1 082 
2018
28
1 726 
0
--- 
2017
38
1 514 
1
577 
2016
22
1 352 
3
1 500 
2015
19
1 595 
0
--- 
2014
30
1 479 
1
670 

Analysis

Structure of prices per m²

Values of price percentiles per m² over the periods used for the estimated price of each type of property.

Structure of transaction amounts

Values of transaction amounts percentiles over the periods used for the estimated price of each type of property.

Transaction amounts and prices per m² by percentile

Ascending order
Percentile
Houses
house
Price per m²
Houses
house
Transaction amount
Apartments
apt.
Price per m²
Apartments
apt.
Transaction amount
10th percentile
1 301 
119 K
719 
89 400 
20th percentile
1 604 
135 K
860 
89 800 
30th percentile
1 753 
153 K
961 
91 000 
40th percentile
1 856 
166 K
1 022 
93 000 
50th percentile
1 980 
189 K
1 082 
95 000 
60th percentile
2 060 
221 K
1 083 
157 K
70th percentile
2 120 
259 K
1 084 
219 K
80th percentile
2 170 
309 K
1 125 
261 K
90th percentile
2 604 
351 K
1 206 
283 K

National and departmental comparison

Evolution of the median price per m² of houses

Evolution of the median price per m² of apartments

Quarterly evolution

Evolution of the median price per m²

Evolution of the number of transactions

Quarterly data

Descending order
Quarter
Houses
house
transactions
Houses
house
Price per m²
Apartments
apt.
transactions
Apartments
apt.
Price per m²
2025 Q2
6
1 738 
0
--- 
2025 Q1
3
2 119 
0
--- 
2024 Q4
6
2 062 
1
931 
2024 Q3
5
2 033 
0
--- 
2024 Q2
3
1 961 
0
--- 
2024 Q1
5
1 795 
0
--- 
2023 Q4
10
1 977 
0
--- 
2023 Q3
9
2 355 
0
--- 
2023 Q2
7
1 839 
0
--- 
2023 Q1
10
2 028 
0
--- 
2022 Q4
7
2 202 
0
--- 
2022 Q3
7
2 431 
0
--- 
2022 Q2
7
1 933 
0
--- 
2022 Q1
8
1 694 
0
--- 
2021 Q4
6
1 795 
0
--- 
2021 Q3
13
1 718 
0
--- 
2021 Q2
7
1 732 
0
--- 
2021 Q1
6
2 113 
1
1 085 
2020 Q4
9
1 753 
0
--- 
2020 Q3
7
2 023 
0
--- 
2020 Q2
11
1 594 
0
--- 
2020 Q1
8
1 608 
1
1 286 
2019 Q4
6
1 056 
0
--- 
2019 Q3
7
1 438 
1
1 082 
2019 Q2
9
1 616 
0
--- 
2019 Q1
8
1 751 
0
--- 
2018 Q4
8
1 726 
0
--- 
2018 Q3
9
1 854 
0
--- 
2018 Q2
7
1 444 
0
--- 
2018 Q1
4
1 672 
0
--- 
2017 Q4
9
1 297 
0
--- 
2017 Q3
12
1 663 
1
577 
2017 Q2
8
1 202 
0
--- 
2017 Q1
9
1 679 
0
--- 
2016 Q4
7
1 296 
0
--- 
2016 Q3
4
1 362 
1
4 704 
2016 Q2
4
1 460 
1
528 
2016 Q1
7
1 256 
1
1 500 
2015 Q4
5
1 580 
0
--- 
2015 Q3
8
1 671 
0
--- 
2015 Q2
3
822 
0
--- 
2015 Q1
3
1 761 
0
--- 
2014 Q4
13
1 483 
0
--- 
2014 Q3
7
1 613 
1
670 
2014 Q2
5
1 350 
0
--- 
2014 Q1
5
1 404 
0
--- 

Overview of the latest real estate transactions

The following list is an anonymized overview of the latest transactions. For more details and to find all transactions, please use the map to view transactions by plot or the transaction search page for a search by criteria.

2025-06-04
130 000 
Sale
Land
8062 m2
-Terres
Land
47231 m2
-Terres
Land
22459 m2
-Terres
Land
14753 m2
-Terres
Land
11734 m2
-Terres
Land
1121 m2
-Terres
Land
2066 m2
-Terres
Land
7607 m2
-Terres
Land
30427 m2
-Terres
Land
10708 m2
-Terres
Land
2870 m2
-Terres
Land
946 m2
-Terres
Land
7935 m2
-Terres
Land
39589 m2
-Terres
Land
3178 m2
-Terres
Land
12800 m2
-Terres
Land
475 m2
-Terres
Land
27439 m2
-Terres
Land
4629 m2
-Terres
Land
1343 m2
-Terres
Land
879 m2
-Terres
Land
12938 m2
-Terres
Land
1449 m2
-Terres
Land
42249 m2
-Terres
Land
7750 m2
-Terres
2025-05-26
55 000 
1 146  /m²(48 m²)
Sale
Houses
House
2 rooms
48 m2
1 outbuilding
Land
113 m2
-Sols
Land
40 m2
-Sols
2025-05-16
217 600 
2 560  /m²(85 m²)
Sale
Houses
House
3 rooms
85 m2
1 outbuilding
Land
530 m2
-Sols
2025-05-12
426 000 
1 936  /m²(220 m²)
Sale
Houses
House
6 rooms
220 m2
2 outbuildings
Land
300 m2
-Sols
Land
331 m2
-Jardins
Land
300 m2
-Sols
Land
1069 m2
-Jardins
2025-04-16
320 000 
1 649  /m²(194 m²)
Sale
Houses
House
8 rooms
194 m2
2 outbuildings
Land
1652 m2
-Sols
2025-04-09
179 000 
1 827  /m²(98 m²)
Sale
Houses
House
3 rooms
98 m2
Land
1425 m2
-Sols
2025-04-03
59 800 
757  /m²(79 m²)
Sale
Houses
House
4 rooms
79 m2
Land
403 m2
-Sols
2025-03-27
305 870 
2 124  /m²(144 m²)
Sale
Houses
House
3 rooms
72 m2
Houses
House
3 rooms
72 m2
Land
790 m2
-Sols
2025-03-26
120 000 
375  /m²(320 m²)
Sale
Commercial property
320 m2
Land
1200 m2
-Sols
Land
50 m2
-Sols
2025-02-12
160 000 
1 798  /m²(89 m²)
Sale
Houses
House
5 rooms
89 m2
Land
880 m2
-Sols
2025-01-20
10 900 
Sale
Land
4619 m2
-Terres
Land
15197 m2
-Terres
2025-01-20
12 715 
Sale
Land
13743 m2
-Terres
Land
9372 m2
-Terres
2025-01-16
39 700 
Sale
Land
78780 m2
-Terres
Land
19700 m2
-Terres
Land
14900 m2
-Terres
2025-01-10
409 000 
2 119  /m²(193 m²)
Sale
Houses
House
8 rooms
193 m2
Land
13242 m2
-Terrains d'agrément
Land
1000 m2
-Sols
Land
2367 m2
-Landes
2024-12-23
225 000 
3 000  /m²(75 m²)
Sale
Houses
House
4 rooms
75 m2
Land
842 m2
-Sols
2024-12-09
95 000 
931  /m²(102 m²)
Sale
Apartments
Apartment
3 rooms
45 m2
Apartments
Apartment
3 rooms
57 m2
Land
525 m2
-Sols
2024-12-02
126 000 
2 100  /m²(60 m²)
Sale
Houses
House
3 rooms
60 m2
2 outbuildings
Land
747 m2
-Sols
2024-11-25
42 000 
Sale
Land
1750 m2
-Terres
Land
5611 m2
-Eaux
/ETANG
2024-11-20
290 000 
1 318  /m²(220 m²)
Sale
Houses
House
4 rooms
220 m2
1 outbuilding
Land
1040 m2
-Sols
Land
3975 m2
-Terrains d'agrément
2024-11-18
157 000 
1 635  /m²(96 m²)
Sale
Houses
House
4 rooms
96 m2
Land
784 m2
-Sols
531 transactions listed in the municipality

Côte-d'Or (21)

Most expensive cities

City
name
Descending orderHouses
house
Price per m²
3 333 
3 264 
3 218 
3 137 
3 105 
3 047 
3 030 
City
name
Descending orderApartments
apt.
Price per m²
3 394 
3 012 
2 886 
2 846 

Least expensive cities

City
name
Ascending orderHouses
house
Price per m²
210 
225 
250 
274 
287 
287 
357 
City
name
Ascending orderApartments
apt.
Price per m²
58 
65 
74 
79 
112