emooki
HomePrice mapTransactions
🇬🇧 English🇫🇷 Français🇩🇪 Deutsch🇪🇸 Español🇮🇹 Italiano

Real estate price map


Real estate price map in the municipality of Messigny-et-Vantoux, choose a section to see transactions by parcel.

Côte-d'Or (21)
Messigny-et-Vantoux

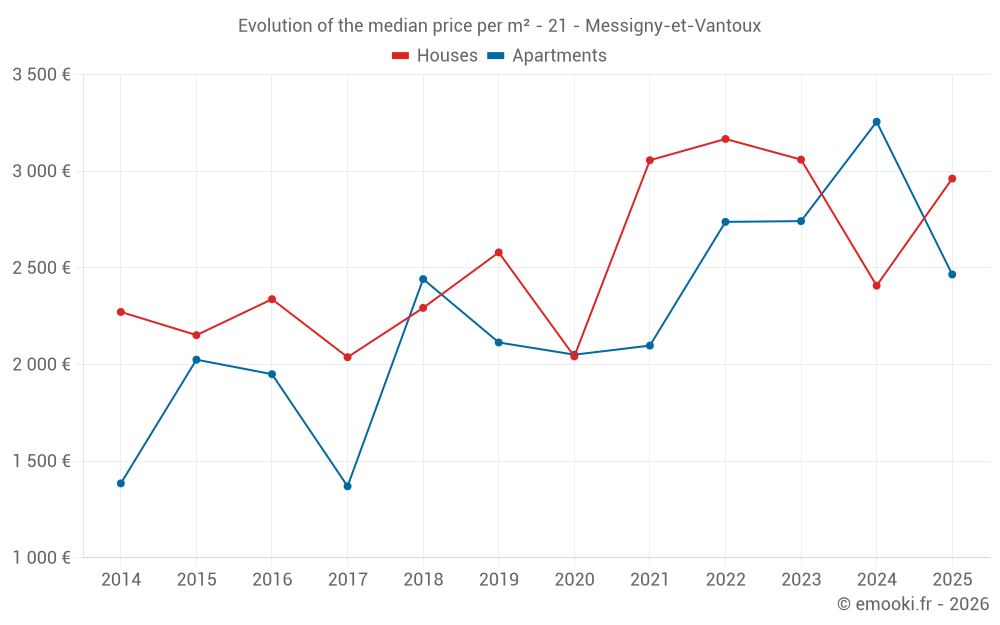
Median price of real estate
in the municipality of Messigny-et-Vantoux

HousesHouses
2 903 € /m²
1-23-45-67-89-10
Reliability 7/10
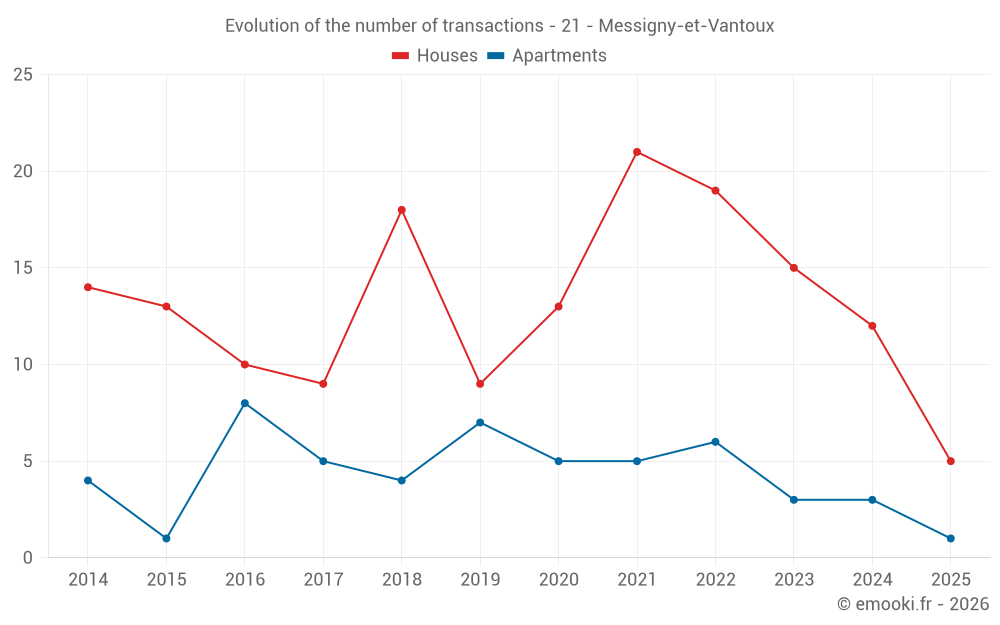
Median price on the 28 transactions of the last 24 months.
from 2 213 to
3 652 € /m²
60% of transactions from the 2nd to the 8th deciles.
ApartmentsApartments
2 742 € /m²
1-23-45-67-89-10
Reliability 5/10
Median price on the 15 transactions of the last 48 months.
from 2 063 to
3 286 € /m²
60% of transactions from the 2nd to the 8th deciles.
DwellingsDwellings
2 956 € /m²
1-23-45-67-89-10
Reliability 8/10
Median price on the 19 transactions of the last 12 months.
from 2 120 to
3 320 € /m²
60% of transactions from the 2nd to the 8th deciles.
HousesEvolution of the price per m² of houses since...
1 year
+23%
2 years
-3.2%
3 years
-6.5%
4 years
-3.1%
5 years
+45%
6 years
+15%
7 years
+29%
8 years
+45%
9 years
+27%
10 years
+38%
11 years
+30%
The price per m² of houses has decreased by 6.5% since 3 years, but it has increased by 45% in 8 years.

Yearly evolution

Evolution of the median price per m²

Evolution of the number of transactions

Warning, last year incomplete. Projections made based on the proportions between semesters of the previous year at the departmental/national level and by type of property.

Yearly data

Descending order
Year
Houses
house
transactions
Houses
house
Price per m²
Apartments
apt.
transactions
Apartments
apt.
Price per m²
2025
5
2 962 €
1
2 466 €
2024
12
2 408 €
3
3 256 €
2023
15
3 060 €
3
2 742 €
2022
19
3 167 €
6
2 738 €
2021
21
3 057 €
5
2 098 €
2020
13
2 042 €
5
2 051 €
2019
9
2 580 €
7
2 114 €
2018
18
2 293 €
4
2 442 €
2017
9
2 038 €
5
1 370 €
2016
10
2 338 €
8
1 950 €
2015
13
2 152 €
1
2 025 €
2014
14
2 272 €
4
1 385 €

Analysis

Structure of prices per m²

Values of price percentiles per m² over the periods used for the estimated price of each type of property.

Structure of transaction amounts

Values of transaction amounts percentiles over the periods used for the estimated price of each type of property.

Transaction amounts and prices per m² by percentile

Ascending order
Percentile
Houses
house
Price per m²
Houses
house
Transaction amount
Apartments
apt.
Price per m²
Apartments
apt.
Transaction amount
10th percentile
1 976 €
141 K€
1 919 €
79 000 €
20th percentile
2 213 €
266 K€
2 063 €
119 K€
30th percentile
2 502 €
287 K€
2 322 €
134 K€
40th percentile
2 726 €
322 K€
2 524 €
152 K€
50th percentile
2 903 €
378 K€
2 742 €
161 K€
60th percentile
3 019 €
431 K€
2 966 €
171 K€
70th percentile
3 407 €
525 K€
3 084 €
241 K€
80th percentile
3 652 €
644 K€
3 286 €
259 K€
90th percentile
4 224 €
885 K€
3 595 €
335 K€

National and departmental comparison

Evolution of the median price per m² of houses

Evolution of the median price per m² of apartments

Quarterly evolution

Evolution of the median price per m²

Evolution of the number of transactions

Quarterly data

Descending order
Quarter
Houses
house
transactions
Houses
house
Price per m²
Apartments
apt.
transactions
Apartments
apt.
Price per m²
2025 Q2
1
2 962 €
0
--- €
2025 Q1
4
2 987 €
1
2 466 €
2024 Q4
6
2 234 €
1
3 948 €
2024 Q3
4
2 271 €
2
3 152 €
2024 Q2
2
4 484 €
0
--- €
2023 Q4
4
3 152 €
0
--- €
2023 Q3
7
2 850 €
1
1 923 €
2023 Q2
2
2 476 €
2
3 074 €
2023 Q1
2
3 992 €
0
--- €
2022 Q4
1
2 586 €
1
2 563 €
2022 Q3
8
3 474 €
3
2 286 €
2022 Q2
7
3 167 €
1
3 721 €
2022 Q1
3
3 334 €
1
3 093 €
2021 Q4
3
2 198 €
1
2 098 €
2021 Q3
9
3 103 €
1
1 709 €
2021 Q2
1
5 000 €
3
2 595 €
2021 Q1
8
3 027 €
0
--- €
2020 Q4
3
2 042 €
1
1 481 €
2020 Q3
1
2 791 €
2
2 037 €
2020 Q2
1
2 355 €
2
2 186 €
2020 Q1
8
1 813 €
0
--- €
2019 Q4
3
2 580 €
1
1 592 €
2019 Q3
2
2 822 €
2
2 656 €
2019 Q2
3
2 978 €
2
2 318 €
2019 Q1
1
2 115 €
2
2 000 €
2018 Q4
9
2 333 €
1
2 627 €
2018 Q3
3
2 291 €
2
1 339 €
2018 Q2
3
2 188 €
1
2 409 €
2018 Q1
3
2 257 €
0
--- €
2017 Q4
3
2 250 €
1
2 759 €
2017 Q3
2
2 236 €
1
1 518 €
2017 Q2
2
2 026 €
2
1 163 €
2017 Q1
2
1 669 €
1
859 €
2016 Q4
3
2 375 €
0
--- €
2016 Q3
1
2 571 €
5
1 229 €
2016 Q2
5
2 333 €
2
1 950 €
2016 Q1
1
1 717 €
1
2 530 €
2015 Q4
5
2 152 €
1
2 025 €
2015 Q3
4
3 248 €
0
--- €
2015 Q2
2
1 768 €
0
--- €
2015 Q1
2
2 114 €
0
--- €
2014 Q4
4
2 020 €
1
1 333 €
2014 Q3
6
2 482 €
1
1 484 €
2014 Q2
1
893 €
2
1 128 €
2014 Q1
3
2 333 €
0
--- €

Overview of the latest real estate transactions

The following list is an anonymized overview of the latest transactions. For more details and to find all transactions, please use the map to view transactions by plot or the transaction search page for a search by criteria.

2025-05-19
930 000 €
2 962 € /m²(314 m²)
Sale
Houses
House
8 rooms
314 m2
1 outbuilding
Land
1201 m2
-Sols
Land
1641 m2
-Jardins
Land
2335 m2
-Terrains d'agrément
Land
1890 m2
-Vergers
2025-04-04
4 325 €
Sale
Land
3120 m2
-Vergers
2025-03-05
225 000 €
2 813 € /m²(80 m²)
Sale
Commercial property
80 m2
Land
477 m2
-Sols
2025-02-28
865 400 €
4 555 € /m²(190 m²)
Sale
Houses
House
4 rooms
190 m2
Land
453 m2
-Sols
1 outbuilding
Land
870 m2
-Sols
2025-02-21
71 500 €
2 466 € /m²(29 m²)
Sale
Apartments
Apartment
1 room
29 m2
1 outbuilding
2025-02-18
396 750 €
2 736 € /m²(145 m²)
Sale
Houses
House
7 rooms
145 m2
1 outbuilding
Land
955 m2
-Sols
2025-01-30
265 620 €
3 018 € /m²(88 m²)
Sale
Houses
House
5 rooms
88 m2
Land
391 m2
-Sols
2025-01-29
1 330 000 €
2 956 € /m²(450 m²)
Sale
Houses
House
8 rooms
450 m2
Land
2500 m2
-Sols
Land
2789 m2
-Terrains d'agrément
2025-01-22
89 000 €
4 944 € /m²(18 m²)
Sale
Commercial property
18 m2
2025-01-22
115 000 €
Sale
Land
586 m2
-Terrains à bâtir
2024-12-27
520 000 €
2 488 € /m²(209 m²)
Sale
Houses
House
6 rooms
209 m2
1 outbuilding
Land
312 m2
-Sols
2024-12-19
135 000 €
Sale
Land
485 m2
-Terrains à bâtir
2024-12-11
379 000 €
3 948 € /m²(96 m²)
Sale
Apartments
Apartment
4 rooms
96 m2
3 outbuildings
2024-11-28
300 000 €
1 923 € /m²(156 m²)
Sale
4 outbuildings
Houses
House
6 rooms
156 m2
1 outbuilding
Land
97 m2
-Sols
2024-11-28
800 000 €
1 980 € /m²(404 m²)
Sale
Houses
House
7 rooms
260 m2
Houses
House
4 rooms
84 m2
2 outbuildings
Land
430 m2
-Sols
Houses
House
2 rooms
60 m2
Land
570 m2
-Sols
Land
18 m2
-Sols
Land
100 m2
-Sols
Land
688 m2
-Terrains d'agrément
Land
34 m2
-Jardins
Land
28 m2
-Sols
Land
136 m2
-Sols
Land
20 m2
-Sols
Land
1 m2
-Sols
2024-11-27
80 040 €
460 € /m²(174 m²)
Sale
Houses
House
6 rooms
174 m2
Land
249 m2
-Sols
Land
259 m2
-Sols
Land
308 m2
-Sols
2024-11-08
372 000 €
3 024 € /m²(123 m²)
Sale
Houses
House
6 rooms
123 m2
1 outbuilding
Land
920 m2
-Sols
2024-11-07
97 500 €
848 € /m²(115 m²)
Sale
Commercial property
115 m2
Land
59 m2
-Sols
2024-10-18
120 000 €
Sale
Land
444 m2
-Terrains à bâtir
2024-10-16
413 400 €
3 417 € /m²(121 m²)
Sale
Houses
House
5 rooms
121 m2
Land
214 m2
-Sols
Land
73 m2
-Sols
Land
113 m2
-Sols
433 transactions listed in the municipality

Côte-d'Or (21)

Most expensive cities

City
name
Descending orderHouses
house
Price per m²
3 360 €
3 333 €
3 264 €
3 228 €
3 218 €
3 202 €
3 137 €
3 105 €
3 047 €
3 030 €
City
name
Descending orderApartments
apt.
Price per m²
12 507 €
3 394 €
3 140 €
3 031 €
3 012 €
2 991 €
2 963 €
2 886 €
2 846 €
2 820 €

Least expensive cities

City
name
Ascending orderHouses
house
Price per m²
210 €
225 €
250 €
274 €
287 €
287 €
313 €
327 €
356 €
357 €
City
name
Ascending orderApartments
apt.
Price per m²
20 €
58 €
65 €
74 €
79 €
85 €
112 €
144 €
164 €