emooki
HomePrice mapTransactions
🇬🇧 English🇫🇷 Français🇩🇪 Deutsch🇪🇸 Español🇮🇹 Italiano

Real estate price map


Real estate price map in the municipality of Sennecey-lès-Dijon.

Côte-d'Or (21)
Sennecey-lès-Dijon

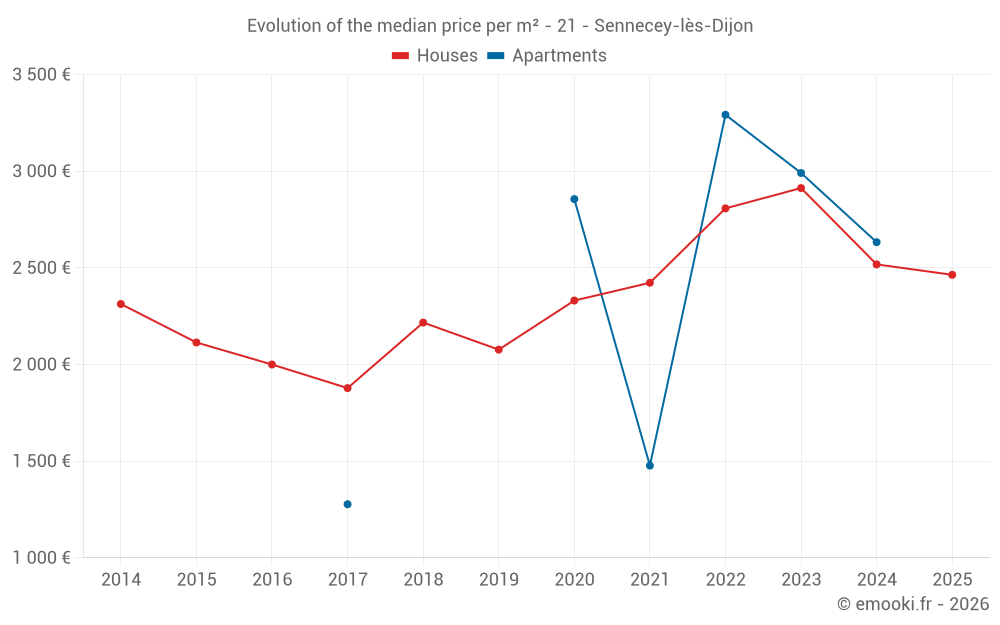
Median price of real estate
in the municipality of Sennecey-lès-Dijon

HousesHouses
2 497  /m²
1-23-45-67-89-10
Reliability 7/10
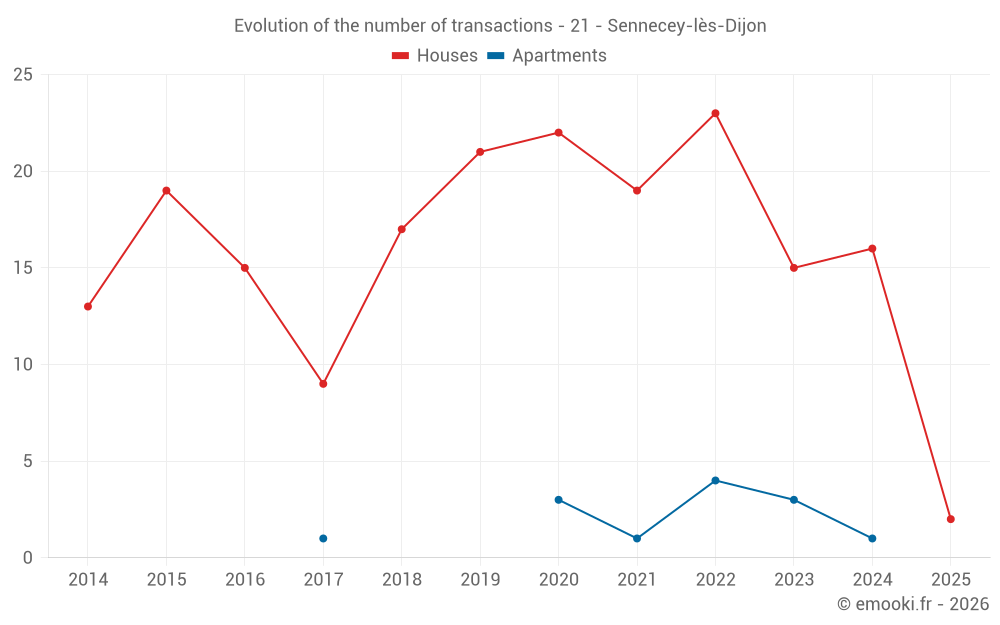
Median price on the 23 transactions of the last 24 months.
from 2 106 to
3 230  /m²
60% of transactions from the 2nd to the 8th deciles.
ApartmentsApartments
2 963  /m²
1-23-45-67-89-10
Reliability 4/10
Median price on the 10 transactions of the last 60 months.
DwellingsDwellings
2 518  /m²
1-23-45-67-89-10
Reliability 7/10
Median price on the 24 transactions of the last 24 months.
from 2 109 to
3 224  /m²
60% of transactions from the 2nd to the 8th deciles.
HousesEvolution of the price per m² of houses since...
1 year
--
2 years
--
3 years
--
4 years
--
5 years
--
6 years
--
7 years
--
8 years
--
9 years
--
10 years
--
11 years
--
ApartmentsEvolution of the price per m² of apartments since...
1 year
--
2 years
--
3 years
--
4 years
--
5 years
--
6 years
--
7 years
--
8 years
--
9 years
--
10 years
--
11 years
--

Yearly evolution

Evolution of the median price per m²

Evolution of the number of transactions

Warning, last year incomplete. Projections made based on the proportions between semesters of the previous year at the departmental/national level and by type of property.

Yearly data

Descending order
Year
Houses
house
transactions
Houses
house
Price per m²
Apartments
apt.
transactions
Apartments
apt.
Price per m²
2025
2
2 464 
0
--- 
2024
16
2 518 
1
2 633 
2023
15
2 913 
3
2 991 
2022
23
2 808 
4
3 292 
2021
19
2 423 
1
1 477 
2020
22
2 331 
3
2 856 
2019
21
2 077 
0
--- 
2018
17
2 217 
0
--- 
2017
9
1 878 
1
1 277 
2016
15
2 000 
0
--- 
2015
19
2 114 
0
--- 
2014
13
2 313 
0
--- 

Analysis

Structure of prices per m²

Values of price percentiles per m² over the periods used for the estimated price of each type of property.

Structure of transaction amounts

Values of transaction amounts percentiles over the periods used for the estimated price of each type of property.

Transaction amounts and prices per m² by percentile

Ascending order
Percentile
Houses
house
Price per m²
Houses
house
Transaction amount
Apartments
apt.
Price per m²
Apartments
apt.
Transaction amount
10th percentile
1 854 
208 K
1 443 
147 K
20th percentile
2 106 
211 K
2 087 
200 K
30th percentile
2 229 
234 K
2 515 
222 K
40th percentile
2 335 
237 K
2 814 
231 K
50th percentile
2 497 
250 K
2 963 
241 K
60th percentile
2 658 
262 K
3 026 
252 K
70th percentile
2 833 
279 K
3 116 
272 K
80th percentile
3 230 
289 K
3 265 
303 K
90th percentile
3 433 
328 K
3 511 
369 K

National and departmental comparison

Evolution of the median price per m² of houses

Evolution of the median price per m² of apartments

Quarterly evolution

Evolution of the median price per m²

Evolution of the number of transactions

Quarterly data

Descending order
Quarter
Houses
house
transactions
Houses
house
Price per m²
Apartments
apt.
transactions
Apartments
apt.
Price per m²
2025 Q1
2
2 464 
0
--- 
2024 Q4
5
2 169 
0
--- 
2024 Q3
5
3 212 
1
2 633 
2024 Q2
3
2 088 
0
--- 
2024 Q1
3
2 841 
0
--- 
2023 Q4
1
3 242 
0
--- 
2023 Q3
4
2 402 
0
--- 
2023 Q2
7
2 913 
1
3 204 
2023 Q1
3
3 516 
2
2 064 
2022 Q4
6
2 388 
1
2 239 
2022 Q3
9
2 985 
3
3 507 
2022 Q2
6
2 685 
0
--- 
2022 Q1
2
3 125 
0
--- 
2021 Q4
8
2 521 
0
--- 
2021 Q3
4
2 536 
1
1 477 
2021 Q2
3
2 245 
0
--- 
2021 Q1
4
1 964 
0
--- 
2020 Q4
5
2 292 
0
--- 
2020 Q3
4
2 692 
1
2 935 
2020 Q2
8
2 229 
0
--- 
2020 Q1
5
2 747 
2
1 996 
2019 Q4
4
1 664 
0
--- 
2019 Q3
8
1 874 
0
--- 
2019 Q2
7
2 562 
0
--- 
2019 Q1
2
1 906 
0
--- 
2018 Q4
5
2 217 
0
--- 
2018 Q3
2
2 270 
0
--- 
2018 Q2
2
1 905 
0
--- 
2018 Q1
8
2 176 
0
--- 
2017 Q4
1
1 942 
1
1 277 
2017 Q3
1
1 653 
0
--- 
2017 Q2
2
1 869 
0
--- 
2017 Q1
5
1 878 
0
--- 
2016 Q4
1
1 589 
0
--- 
2016 Q3
6
2 072 
0
--- 
2016 Q2
5
2 000 
0
--- 
2016 Q1
3
1 402 
0
--- 
2015 Q4
3
2 314 
0
--- 
2015 Q3
3
2 335 
0
--- 
2015 Q2
3
2 191 
0
--- 
2015 Q1
10
2 003 
0
--- 
2014 Q4
2
2 060 
0
--- 
2014 Q3
6
2 245 
0
--- 
2014 Q2
1
2 557 
0
--- 
2014 Q1
4
2 162 
0
--- 

Côte-d'Or (21)

Most expensive cities

City
name
Descending orderHouses
house
Price per m²
3 333 
3 264 
3 218 
3 137 
3 105 
3 047 
3 030 
City
name
Descending orderApartments
apt.
Price per m²
3 394 
3 012 
2 886 
2 846 

Least expensive cities

City
name
Ascending orderHouses
house
Price per m²
210 
225 
250 
274 
287 
287 
357 
City
name
Ascending orderApartments
apt.
Price per m²
58 
65 
74 
79 
112