emooki
HomePrice mapTransactions
🇬🇧 English🇫🇷 Français🇩🇪 Deutsch🇪🇸 Español🇮🇹 Italiano

Real estate price map


Real estate price map in the municipality of Couternon, choose a section to see transactions by parcel.

Côte-d'Or (21)

Couternon - Real estate price m²

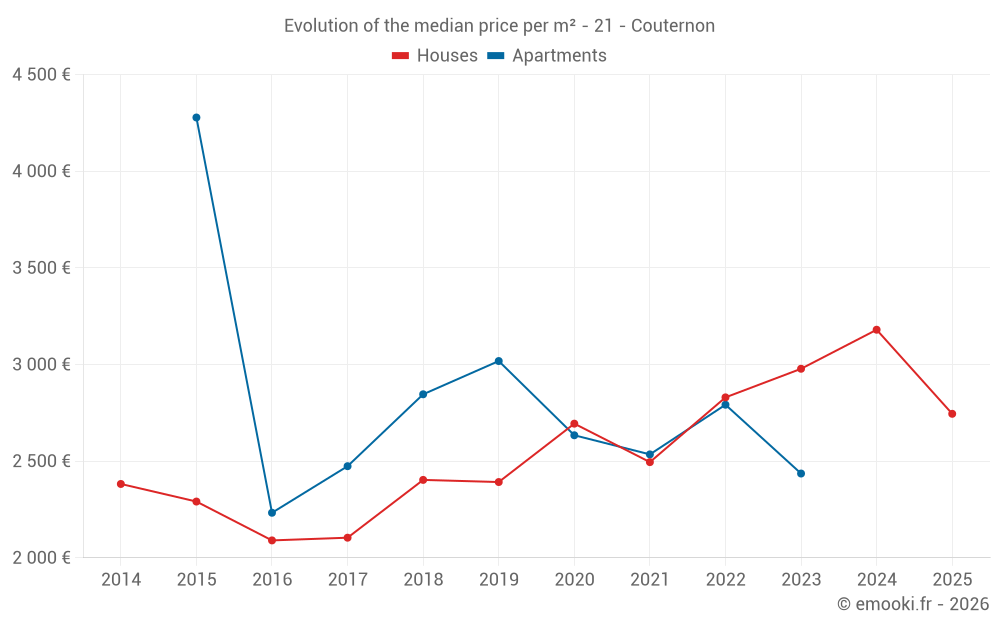
Median price of real estate
in the municipality of Couternon

HousesHouses
2 962  /m²
1-23-45-67-89-10
Reliability 7/10
Median price on the 19 transactions of the last 24 months.
from 2 401 to
3 684  /m²
60% of transactions from the 2nd to the 8th deciles.
ApartmentsApartments
2 740  /m²
1-23-45-67-89-10
Reliability 3/10
Median price on the 8 transactions of the last 72 months.
DwellingsDwellings
2 962  /m²
1-23-45-67-89-10
Reliability 7/10
Median price on the 19 transactions of the last 24 months.
from 2 401 to
3 684  /m²
60% of transactions from the 2nd to the 8th deciles.
HousesEvolution of the price per m² of houses since...
1 year
-14%
2 years
-7.8%
3 years
-3%
4 years
+10%
5 years
+1.9%
6 years
+15%
7 years
+14%
8 years
+30%
9 years
+31%
10 years
+20%
11 years
+15%
The price per m² of houses has decreased by 14% since 1 year, but it has increased by 31% in 9 years.

Yearly evolution

Evolution of the median price per m²

Evolution of the median price per m² - 21 - Couternon

Evolution of the number of transactions

Warning, last year incomplete. Projections made based on the proportions between semesters of the previous year at the departmental/national level and by type of property.

Evolution of the number of transactions - 21 - Couternon

Yearly data

Descending order
Year
Houses
house
transactions
Houses
house
Price per m²
Apartments
apt.
transactions
Apartments
apt.
Price per m²
2025
5
2 745 
0
--- 
2024
9
3 180 
0
--- 
2023
9
2 978 
1
2 436 
2022
14
2 830 
3
2 792 
2021
21
2 495 
1
2 535 
2020
17
2 694 
2
2 634 
2019
13
2 392 
1
3 018 
2018
29
2 403 
4
2 846 
2017
19
2 104 
2
2 474 
2016
26
2 090 
3
2 233 
2015
25
2 291 
2
4 278 
2014
15
2 382 
0
--- 

Analysis

Structure of prices per m²

Values of price percentiles per m² over the periods used for the estimated price of each type of property.

Structure of transaction amounts

Values of transaction amounts percentiles over the periods used for the estimated price of each type of property.

Transaction amounts and prices per m² by percentile

Ascending order
Percentile
Houses
house
Price per m²
Houses
house
Transaction amount
Apartments
apt.
Price per m²
Apartments
apt.
Transaction amount
10th percentile
2 243 
186 K
2 413 
112 K
20th percentile
2 401 
250 K
2 476 
126 K
30th percentile
2 739 
274 K
2 550 
128 K
40th percentile
2 812 
285 K
2 658 
137 K
50th percentile
2 962 
300 K
2 740 
159 K
60th percentile
3 046 
362 K
2 815 
187 K
70th percentile
3 250 
380 K
2 896 
216 K
80th percentile
3 684 
383 K
2 974 
250 K
90th percentile
4 019 
400 K
3 130 
275 K

National and departmental comparison

Evolution of the median price per m² of houses

Evolution of the median price per m² of apartments

Quarterly evolution

Evolution of the median price per m²

Evolution of the number of transactions

Quarterly data

Descending order
Quarter
Houses
house
transactions
Houses
house
Price per m²
Apartments
apt.
transactions
Apartments
apt.
Price per m²
2025 Q2
1
2 404 
0
--- 
2025 Q1
4
2 834 
0
--- 
2024 Q4
4
3 046 
0
--- 
2024 Q3
2
2 846 
0
--- 
2024 Q2
2
3 123 
0
--- 
2024 Q1
1
3 728 
0
--- 
2023 Q4
4
2 873 
0
--- 
2023 Q3
1
3 655 
0
--- 
2023 Q2
2
2 680 
1
2 436 
2023 Q1
2
3 525 
0
--- 
2022 Q4
1
4 717 
0
--- 
2022 Q3
5
2 752 
1
2 792 
2022 Q2
5
3 326 
1
3 390 
2022 Q1
3
2 555 
1
2 689 
2021 Q4
3
2 750 
0
--- 
2021 Q3
5
2 363 
0
--- 
2021 Q2
8
2 416 
0
--- 
2021 Q1
5
2 850 
1
2 535 
2020 Q4
9
3 174 
0
--- 
2020 Q3
5
2 400 
0
--- 
2020 Q2
2
2 785 
0
--- 
2020 Q1
1
2 694 
2
2 634 
2019 Q4
1
2 392 
1
3 018 
2019 Q3
6
2 956 
0
--- 
2019 Q2
1
197 
0
--- 
2019 Q1
5
2 213 
0
--- 
2018 Q4
9
2 352 
0
--- 
2018 Q3
9
2 526 
2
2 485 
2018 Q2
4
2 014 
1
2 563 
2018 Q1
7
2 414 
1
6 509 
2017 Q4
1
2 050 
0
--- 
2017 Q3
8
2 331 
1
2 955 
2017 Q2
3
2 064 
1
1 993 
2017 Q1
7
2 104 
0
--- 
2016 Q4
4
2 466 
0
--- 
2016 Q3
11
1 993 
1
1 449 
2016 Q2
9
2 277 
2
2 358 
2016 Q1
2
2 054 
0
--- 
2015 Q4
4
2 294 
0
--- 
2015 Q3
8
2 290 
1
2 430 
2015 Q2
7
2 387 
0
--- 
2015 Q1
6
2 092 
1
6 126 
2014 Q4
6
2 240 
0
--- 
2014 Q3
3
2 629 
0
--- 
2014 Q2
1
2 477 
0
--- 
2014 Q1
5
2 160 
0
--- 

Overview of the latest real estate transactions

The following list is an anonymized overview of the latest transactions. For more details and to find all transactions, please use the map to view transactions by plot or the transaction search page for a search by criteria.

2025-05-21
250 000 
2 404  /m²(104 m²)
Sale
Houses
House
6 rooms
104 m2
Land
128 m2
-Sols
Land
274 m2
-Sols
Land
600 m2
-Sols
2025-04-09
80 000 
Sale
Land
1033 m2
-Terrains à bâtir
2025-04-07
2 200 
Sale
Land
5160 m2
-Terres
2025-03-21
279 000 
2 735  /m²(102 m²)
Sale
Houses
House
5 rooms
102 m2
Land
208 m2
-Sols
Land
48 m2
-Sols
2025-03-21
350 000 
Sale
Land
1569 m2
-Sols
2025-03-20
382 900 
2 968  /m²(129 m²)
Sale
Houses
House
6 rooms
129 m2
Land
405 m2
-Sols
2025-02-12
140 000 
Sale
Land
346 m2
-Jardins
1 outbuilding
Land
245 m2
-Sols
Land
146 m2
-Sols
2025-02-12
45 000 
Sale
Land
265 m2
-Jardins
2025-02-07
190 000 
2 923  /m²(65 m²)
Sale
Houses
House
4 rooms
65 m2
Land
279 m2
-Sols
Land
196 m2
-Jardins
2025-01-08
291 000 
2 745  /m²(106 m²)
Sale
Houses
House
5 rooms
106 m2
Land
840 m2
-Sols
Land
67 m2
-Sols
Land
417 m2
-Eaux
/Fosse
Land
400 m2
-Terrains d'agrément
2024-12-27
156 500 
1 956  /m²(80 m²)
Sale
Houses
House
4 rooms
80 m2
Land
111 m2
-Sols
Land
4 m2
-Sols
Land
5 m2
-Sols
Land
5 m2
-Sols
Land
66 m2
-Sols
Land
89 m2
-Sols
2024-12-20
2 178 
Sale
Land
3960 m2
-Terres
2024-12-19
170 000 
2 125  /m²(80 m²)
Sale
Houses
House
3 rooms
80 m2
Land
237 m2
-Sols
Land
411 m2
-Sols
2024-12-11
382 000 
4 775  /m²(80 m²)
Sale
Houses
House
3 rooms
80 m2
1 outbuilding
Land
828 m2
-Sols
2024-11-08
615 000 
3 968  /m²(155 m²)
Sale
Land
158 m2
-Sols
Land
55 m2
-Sols
Houses
House
6 rooms
155 m2
1 outbuilding
Land
600 m2
-Sols
Land
43 m2
-Terrains à bâtir
Land
25 m2
-Sols
Land
100 m2
-Sols
Land
300 m2
-Terrains d'agrément
2024-10-24
1 
Sale
Land
166 m2
-Sols
Land
2 m2
-Sols
2024-09-24
350 000 
2 397  /m²(146 m²)
Sale
Houses
House
5 rooms
146 m2
Land
595 m2
-Sols
2024-07-26
461 450 
3 296  /m²(140 m²)
Sale
Houses
House
5 rooms
140 m2
Land
807 m2
-Sols
2024-07-15
5 500 
Sale
Land
9990 m2
-Terres
2024-07-11
1 
Sale
Land
10 m2
-Sols
327 transactions listed in the municipality

Côte-d'Or (21)

Most expensive cities

City
name
Descending orderHouses
house
Price per m²
3 333 
3 264 
3 218 
3 137 
3 105 
3 047 
3 030 
City
name
Descending orderApartments
apt.
Price per m²
3 394 
3 012 
2 886 
2 846 

Least expensive cities

City
name
Ascending orderHouses
house
Price per m²
210 
225 
250 
274 
287 
287 
357 
City
name
Ascending orderApartments
apt.
Price per m²
58 
65 
74 
79 
112