Median price of real estate
in the municipality of La Genétouze
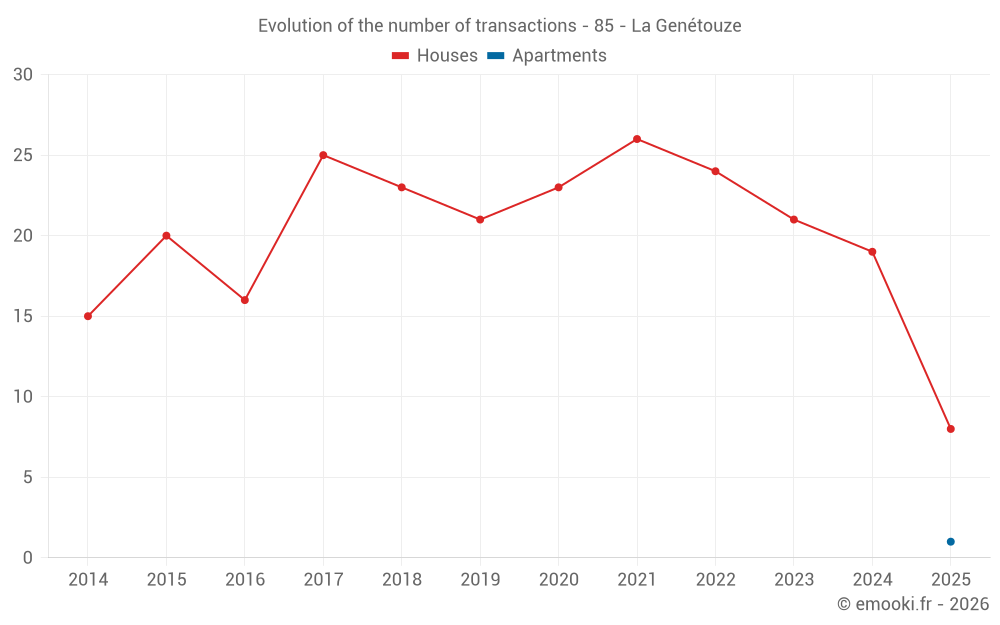
Houses
2 308 € /m²
Reliability 8/10
Median price on the 21 transactions of the last 12 months.
from 1 726 to
2 527 € /m²
2 527 € /m²
60% of transactions from the 2nd to the 8th deciles.
Apartments
532 € /m²
Reliability 1/10
Price of the unique transaction of the last 120 months.
Dwellings
2 265 € /m²
Reliability 8/10
Median price on the 22 transactions of the last 12 months.
from 1 632 to
2 495 € /m²
2 495 € /m²
60% of transactions from the 2nd to the 8th deciles.