Real estate price map
Real estate price map in the municipality of Aizenay, choose a section to see transactions by parcel.
Vendée (85)
Price per m² in Aizenay
Median price of real estate
in the municipality of Aizenay
Houses
2 273 € /m²
Reliability 10/10
Median price on the 26 transactions of the last 3 months.
from 1 213 to
2 529 € /m²
2 529 € /m²
60% of transactions from the 2nd to the 8th deciles.
Apartments
2 789 € /m²
Reliability 5/10
Median price on the 19 transactions of the last 48 months.
from 1 836 to
2 927 € /m²
2 927 € /m²
60% of transactions from the 2nd to the 8th deciles.
Dwellings
2 273 € /m²
Reliability 10/10
Median price on the 26 transactions of the last 3 months.
from 1 213 to
2 529 € /m²
2 529 € /m²
60% of transactions from the 2nd to the 8th deciles.
Evolution of the price per m² of houses since...
1 year
-2.2%
2 years
-2.9%
3 years
-8.2%
4 years
+2.7%
5 years
+27%
6 years
+24%
7 years
+34%
8 years
+41%
9 years
+37%
10 years
+46%
11 years
+56%
The price per m² of houses has decreased by 8.2% since 3 years, but it has increased by 56% in 11 years.
2712 transactions listed in the municipality
Yearly data
Yearly evolution of the median price per m²

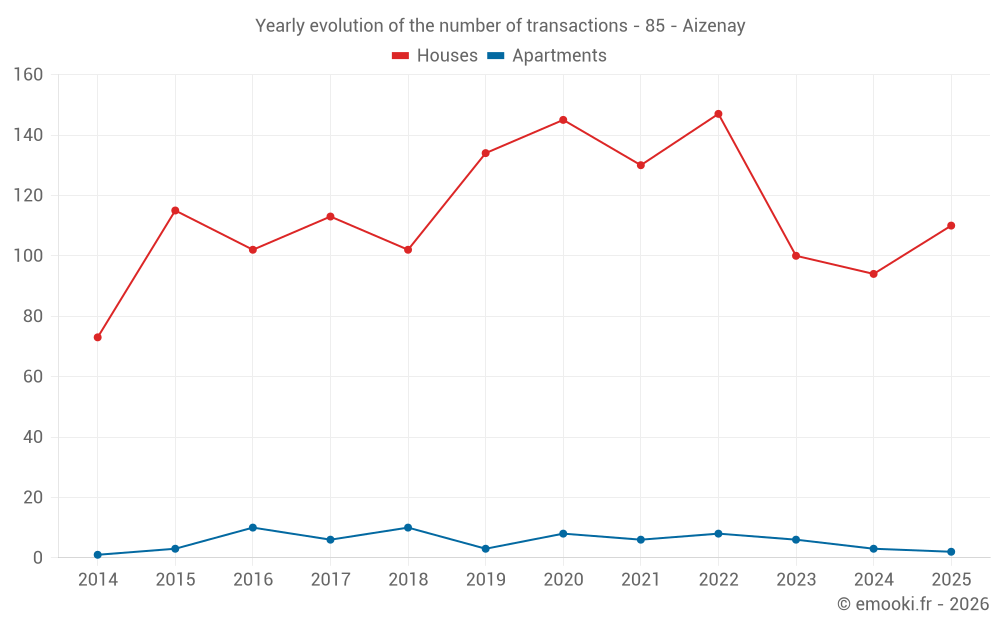
Yearly evolution of the number of transactions
Yearly table
Year
house
transactions
transactions
house
Price per m²
Price per m²
apt.
transactions
transactions
apt.
Price per m²
Price per m²
2025
110
2 395 €
2
2 148 €
2024
94
2 450 €
3
2 791 €
2023
100
2 466 €
6
2 828 €
2022
147
2 609 €
8
2 034 €
2021
130
2 332 €
6
2 837 €
2020
145
1 881 €
8
1 714 €
2019
134
1 930 €
3
2 359 €
2018
102
1 787 €
10
1 399 €
2017
113
1 703 €
6
2 841 €
2016
102
1 754 €
10
2 371 €
2015
115
1 643 €
3
1 417 €
2014
73
1 539 €
1
2 133 €
Analysis
Structure of prices per m²
Values of price percentiles per m² over the periods used for the estimated price of each type of property.
Structure of transaction amounts
Values of transaction amounts percentiles over the periods used for the estimated price of each type of property.
Transaction amounts and prices per m² by percentile
Percentile
house
Price per m²
Price per m²
house
Transaction amount
Transaction amount
apt.
Price per m²
Price per m²
apt.
Transaction amount
Transaction amount
10th percentile
860 €
134 K€
1 696 €
117 K€
20th percentile
1 213 €
143 K€
1 836 €
119 K€
30th percentile
1 616 €
151 K€
2 006 €
122 K€
40th percentile
1 872 €
163 K€
2 576 €
129 K€
50th percentile
2 273 €
195 K€
2 789 €
135 K€
60th percentile
2 393 €
217 K€
2 792 €
147 K€
70th percentile
2 460 €
237 K€
2 834 €
159 K€
80th percentile
2 529 €
246 K€
2 927 €
182 K€
90th percentile
2 874 €
287 K€
3 121 €
213 K€
National and departmental comparison
Evolution of the median price per m² of houses
Evolution of the median price per m² of apartments
Quarterly data
Quarterly evolution of the median price per m²
Quarterly evolution of the number of transactions
Quarterly table
Quarter
house
transactions
transactions
house
Price per m²
Price per m²
apt.
transactions
transactions
apt.
Price per m²
Price per m²
2025 Q4
26
2 273 €
0
--- €
2025 Q3
43
2 699 €
1
3 371 €
2025 Q2
22
2 354 €
0
--- €
2025 Q1
19
2 371 €
1
924 €
2024 Q4
20
2 368 €
0
--- €
2024 Q3
32
2 514 €
1
2 791 €
2024 Q2
24
2 443 €
2
2 834 €
2024 Q1
18
2 335 €
0
--- €
2023 Q4
24
2 293 €
1
3 082 €
2023 Q3
31
2 396 €
3
2 800 €
2023 Q2
18
2 481 €
0
--- €
2023 Q1
27
2 744 €
2
2 824 €
2022 Q4
30
2 478 €
2
1 815 €
2022 Q3
39
2 650 €
1
2 174 €
2022 Q2
44
2 581 €
3
2 789 €
2022 Q1
34
2 672 €
2
1 671 €
2021 Q4
37
2 403 €
2
2 978 €
2021 Q3
39
2 361 €
0
--- €
2021 Q2
31
2 300 €
4
2 657 €
2021 Q1
23
2 222 €
0
--- €
2020 Q4
39
1 926 €
5
1 494 €
2020 Q3
33
1 898 €
0
--- €
2020 Q2
43
1 780 €
0
--- €
2020 Q1
30
1 921 €
3
1 972 €
2019 Q4
44
1 978 €
1
1 750 €
2019 Q3
43
1 929 €
0
--- €
2019 Q2
26
1 918 €
1
2 551 €
2019 Q1
21
1 705 €
1
2 359 €
2018 Q4
33
1 810 €
1
2 891 €
2018 Q3
25
1 886 €
5
1 210 €
2018 Q2
25
1 416 €
2
3 413 €
2018 Q1
19
1 922 €
2
1 207 €
2017 Q4
32
1 754 €
0
--- €
2017 Q3
26
1 856 €
1
2 667 €
2017 Q2
30
1 520 €
5
3 015 €
2017 Q1
25
1 692 €
0
--- €
2016 Q4
16
1 802 €
2
1 006 €
2016 Q3
31
1 747 €
3
2 667 €
2016 Q2
34
1 746 €
3
2 599 €
2016 Q1
21
1 748 €
2
2 423 €
2015 Q4
27
1 727 €
1
1 415 €
2015 Q3
33
1 716 €
1
1 417 €
2015 Q2
30
1 574 €
1
2 500 €
2015 Q1
25
1 608 €
0
--- €
2014 Q4
20
1 494 €
0
--- €
2014 Q3
21
1 579 €
1
2 133 €
2014 Q2
10
1 612 €
0
--- €
2014 Q1
22
1 519 €
0
--- €
Key takeaways
What is the price per m2 of houses in Aizenay?
The median price on the 26 house transactions of the last 3 months in the municipality of Aizenay was 2 273 € per square meter for a median property value of 195 250 €. Over this period, 60% of transactions were between 1 213 and 2 529 € per square meter (from the 2nd to the 8th deciles).
Compare with neighboring municipalities
City
name
name
house
Price per m²
Price per m²
apt.
Price per m²
Price per m²
City information
Zip code
- 85190 AIZENAY