emooki
HomePrice mapTransactions
🇬🇧 English🇫🇷 Français🇩🇪 Deutsch🇪🇸 Español🇮🇹 Italiano

Real estate price map


Real estate price map in the municipality of Jard-sur-Mer.

Vendée (85)
Jard-sur-Mer

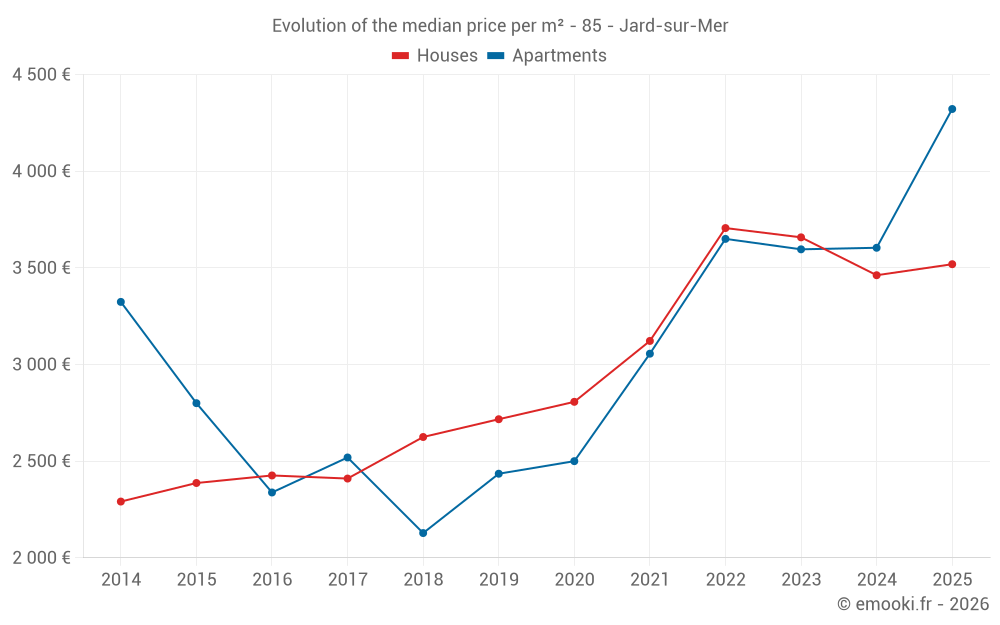
Median price of real estate
in the municipality of Jard-sur-Mer

HousesHouses
3 519 € /m²
1-23-45-67-89-10
Reliability 9/10
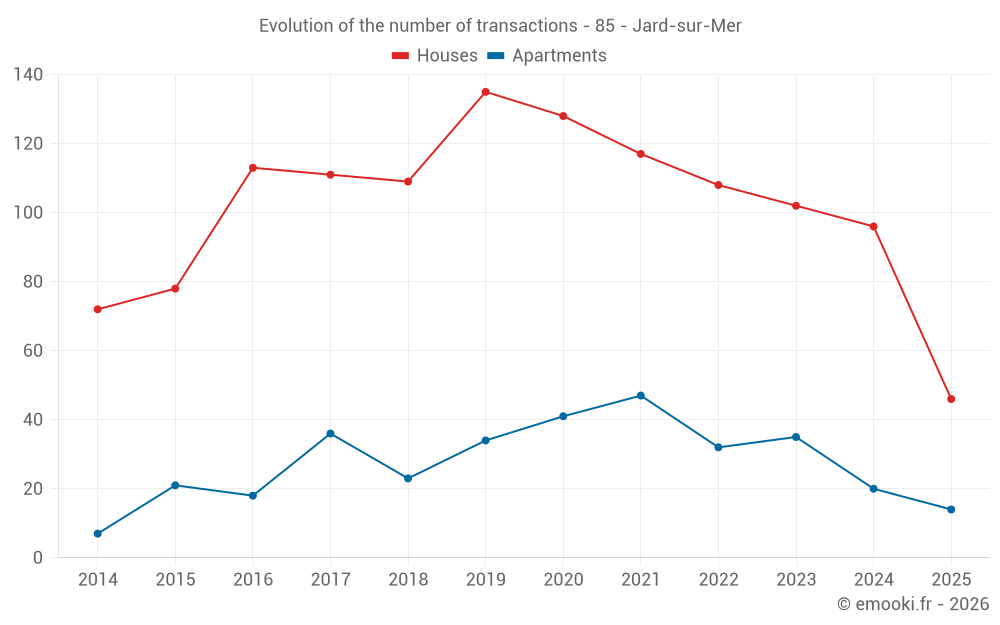
Median price on the 46 transactions of the last 6 months.
from 2 566 to
4 243 € /m²
60% of transactions from the 2nd to the 8th deciles.
ApartmentsApartments
3 966 € /m²
1-23-45-67-89-10
Reliability 8/10
Median price on the 27 transactions of the last 12 months.
from 2 695 to
5 120 € /m²
60% of transactions from the 2nd to the 8th deciles.
DwellingsDwellings
3 854 € /m²
1-23-45-67-89-10
Reliability 10/10
Median price on the 28 transactions of the last 3 months.
from 2 699 to
4 741 € /m²
60% of transactions from the 2nd to the 8th deciles.
HousesEvolution of the price per m² of houses since...
1 year
+1.6%
2 years
-3.8%
3 years
-5%
4 years
+13%
5 years
+25%
6 years
+30%
7 years
+34%
8 years
+46%
9 years
+45%
10 years
+47%
11 years
+54%
ApartmentsEvolution of the price per m² of apartments since...
1 year
+20%
2 years
+20%
3 years
+18%
4 years
+41%
5 years
+73%
6 years
+77%
7 years
+103%
8 years
+72%
9 years
+85%
10 years
+54%
11 years
+30%

Yearly evolution

Evolution of the median price per m²

Evolution of the number of transactions

Warning, last year incomplete. Projections made based on the proportions between semesters of the previous year at the departmental/national level and by type of property.

Yearly data

Descending order
Year
Houses
house
transactions
Houses
house
Price per m²
Apartments
apt.
transactions
Apartments
apt.
Price per m²
2025
46
3 519 €
14
4 322 €
2024
96
3 462 €
20
3 604 €
2023
102
3 658 €
35
3 596 €
2022
108
3 706 €
32
3 650 €
2021
117
3 122 €
47
3 056 €
2020
128
2 807 €
41
2 500 €
2019
135
2 717 €
34
2 435 €
2018
109
2 625 €
23
2 128 €
2017
111
2 410 €
36
2 519 €
2016
113
2 426 €
18
2 338 €
2015
78
2 387 €
21
2 800 €
2014
72
2 291 €
7
3 324 €

Analysis

Structure of prices per m²

Values of price percentiles per m² over the periods used for the estimated price of each type of property.

Structure of transaction amounts

Values of transaction amounts percentiles over the periods used for the estimated price of each type of property.

Transaction amounts and prices per m² by percentile

Ascending order
Percentile
Houses
house
Price per m²
Houses
house
Transaction amount
Apartments
apt.
Price per m²
Apartments
apt.
Transaction amount
10th percentile
2 126 €
152 K€
2 331 €
92 600 €
20th percentile
2 566 €
175 K€
2 695 €
112 K€
30th percentile
3 021 €
210 K€
2 949 €
115 K€
40th percentile
3 333 €
228 K€
3 663 €
127 K€
50th percentile
3 519 €
254 K€
3 966 €
143 K€
60th percentile
3 802 €
274 K€
4 522 €
156 K€
70th percentile
4 035 €
309 K€
4 935 €
166 K€
80th percentile
4 243 €
320 K€
5 120 €
194 K€
90th percentile
4 902 €
542 K€
5 293 €
247 K€

National and departmental comparison

Evolution of the median price per m² of houses

Evolution of the median price per m² of apartments

Quarterly evolution

Evolution of the median price per m²

Evolution of the number of transactions

Quarterly data

Descending order
Quarter
Houses
house
transactions
Houses
house
Price per m²
Apartments
apt.
transactions
Apartments
apt.
Price per m²
2025 Q2
19
3 802 €
9
3 966 €
2025 Q1
27
3 500 €
5
5 071 €
2024 Q4
34
3 694 €
8
3 452 €
2024 Q3
24
3 694 €
5
4 211 €
2024 Q2
16
3 201 €
4
3 664 €
2024 Q1
22
3 260 €
3
3 333 €
2023 Q4
29
3 909 €
6
4 922 €
2023 Q3
23
3 789 €
11
3 444 €
2023 Q2
29
3 239 €
8
3 626 €
2023 Q1
21
3 612 €
10
3 519 €
2022 Q4
30
3 830 €
5
4 387 €
2022 Q3
33
4 044 €
9
3 800 €
2022 Q2
26
3 714 €
9
3 500 €
2022 Q1
19
3 644 €
9
3 238 €
2021 Q4
27
3 726 €
9
3 333 €
2021 Q3
24
2 916 €
10
3 294 €
2021 Q2
41
3 122 €
9
3 056 €
2021 Q1
25
2 988 €
19
2 429 €
2020 Q4
47
2 792 €
22
2 590 €
2020 Q3
33
2 986 €
11
2 500 €
2020 Q2
26
2 776 €
2
1 786 €
2020 Q1
22
2 815 €
6
2 610 €
2019 Q4
43
2 755 €
9
2 138 €
2019 Q3
39
2 774 €
8
2 631 €
2019 Q2
20
2 903 €
8
2 268 €
2019 Q1
33
2 446 €
9
2 464 €
2018 Q4
27
2 643 €
5
2 326 €
2018 Q3
32
2 548 €
8
2 521 €
2018 Q2
23
2 862 €
5
2 024 €
2018 Q1
27
2 571 €
5
2 111 €
2017 Q4
32
2 738 €
10
2 439 €
2017 Q3
32
2 391 €
8
2 848 €
2017 Q2
32
2 351 €
10
3 140 €
2017 Q1
15
2 329 €
8
2 237 €
2016 Q4
34
2 183 €
7
2 769 €
2016 Q3
32
2 500 €
3
2 488 €
2016 Q2
28
2 475 €
3
1 902 €
2016 Q1
19
2 600 €
5
1 719 €
2015 Q4
25
2 283 €
9
2 314 €
2015 Q3
21
2 281 €
5
2 800 €
2015 Q2
14
2 432 €
3
3 793 €
2015 Q1
18
2 407 €
4
2 262 €
2014 Q4
25
2 274 €
1
2 815 €
2014 Q3
17
2 565 €
3
3 684 €
2014 Q2
14
2 140 €
2
2 541 €
2014 Q1
16
2 349 €
1
4 483 €

Vendée (85)

Most expensive cities

City
name
Descending orderHouses
house
Price per m²
5 492 €
5 003 €
4 318 €
4 081 €
3 721 €
3 672 €
3 585 €
3 519 €
3 431 €
3 421 €
City
name
Descending orderApartments
apt.
Price per m²
4 738 €
4 662 €
4 608 €
4 460 €
4 333 €
4 265 €
4 158 €
3 966 €
3 868 €
3 694 €

Least expensive cities

City
name
Ascending orderHouses
house
Price per m²
667 €
938 €
940 €
977 €
1 000 €
1 040 €
1 060 €
City
name
Ascending orderApartments
apt.
Price per m²
190 €
225 €
287 €
343 €
464 €
469 €
491 €