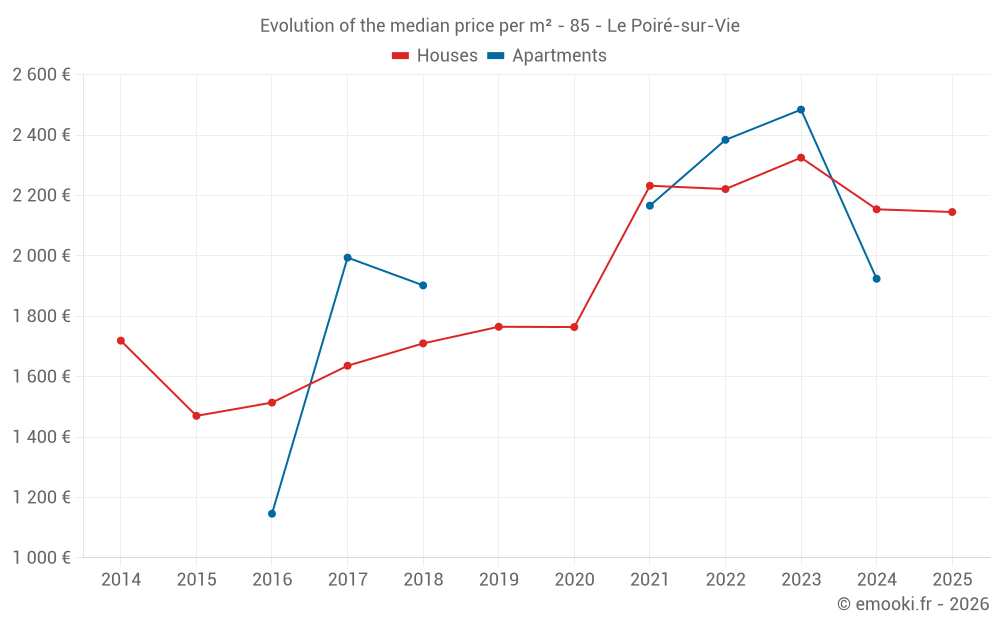
Median price of real estate
in the municipality of Le Poiré-sur-Vie
Houses
2 145 € /m²
Reliability 9/10
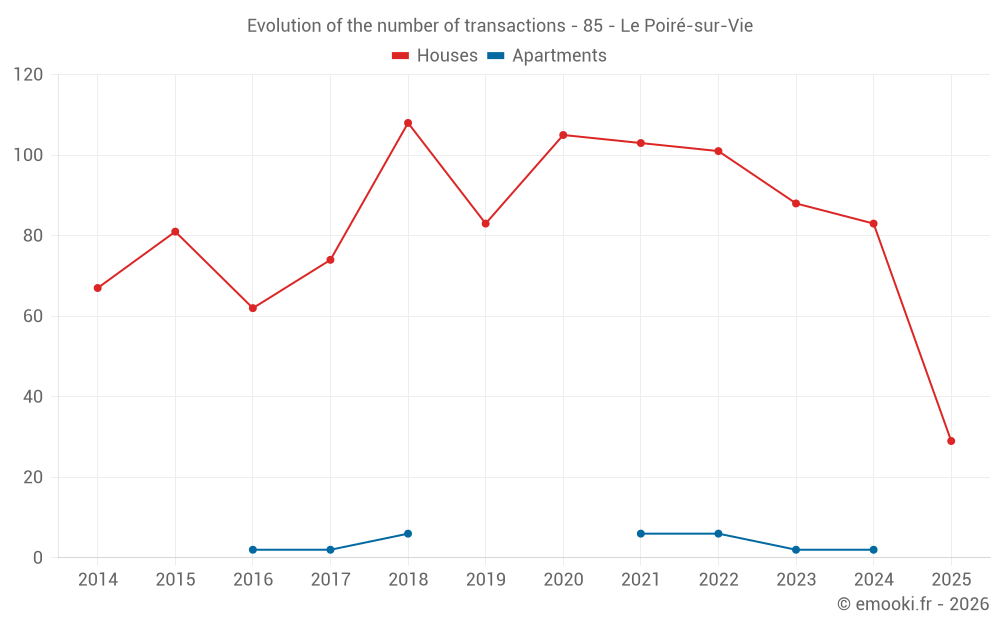
Median price on the 29 transactions of the last 6 months.
from 1 725 to
2 671 € /m²
2 671 € /m²
60% of transactions from the 2nd to the 8th deciles.
Apartments
2 335 € /m²
Reliability 5/10
Median price on the 14 transactions of the last 48 months.
from 2 172 to
2 567 € /m²
2 567 € /m²
60% of transactions from the 2nd to the 8th deciles.
Dwellings
2 145 € /m²
Reliability 9/10
Median price on the 29 transactions of the last 6 months.
from 1 725 to
2 671 € /m²
2 671 € /m²
60% of transactions from the 2nd to the 8th deciles.