Median price of real estate
in the municipality of Longeville-sur-Mer
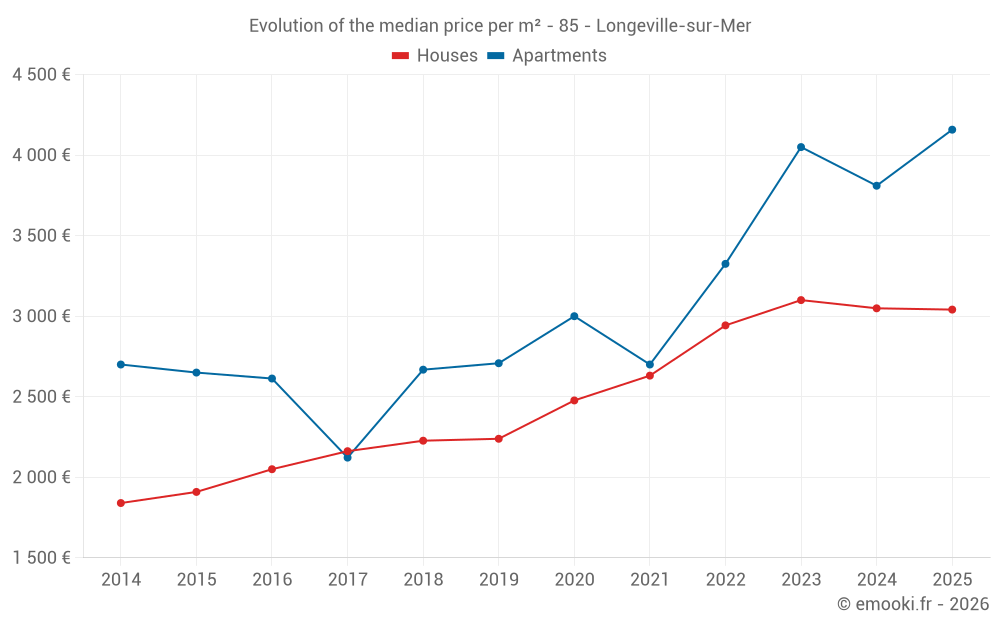
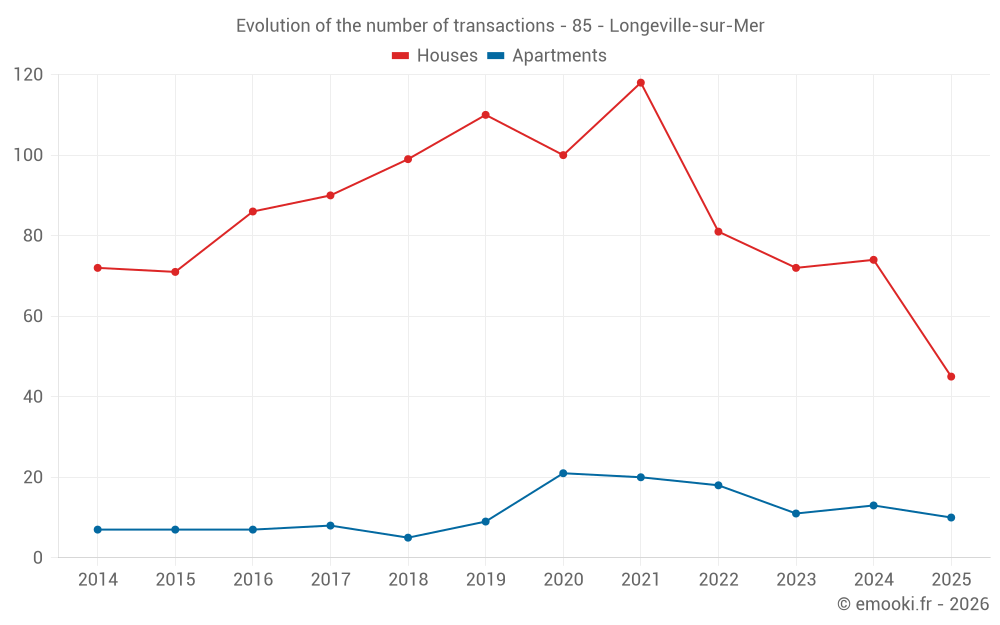
Houses
2 999 € /m²
Reliability 10/10
Median price on the 26 transactions of the last 3 months.
from 2 390 to
3 950 € /m²
3 950 € /m²
60% of transactions from the 2nd to the 8th deciles.
Apartments
4 158 € /m²
Reliability 8/10
Median price on the 16 transactions of the last 12 months.
from 2 662 to
4 876 € /m²
4 876 € /m²
60% of transactions from the 2nd to the 8th deciles.
Dwellings
3 059 € /m²
Reliability 10/10
Median price on the 31 transactions of the last 3 months.
from 2 618 to
4 388 € /m²
4 388 € /m²
60% of transactions from the 2nd to the 8th deciles.