Median price of real estate
in the Tarn department
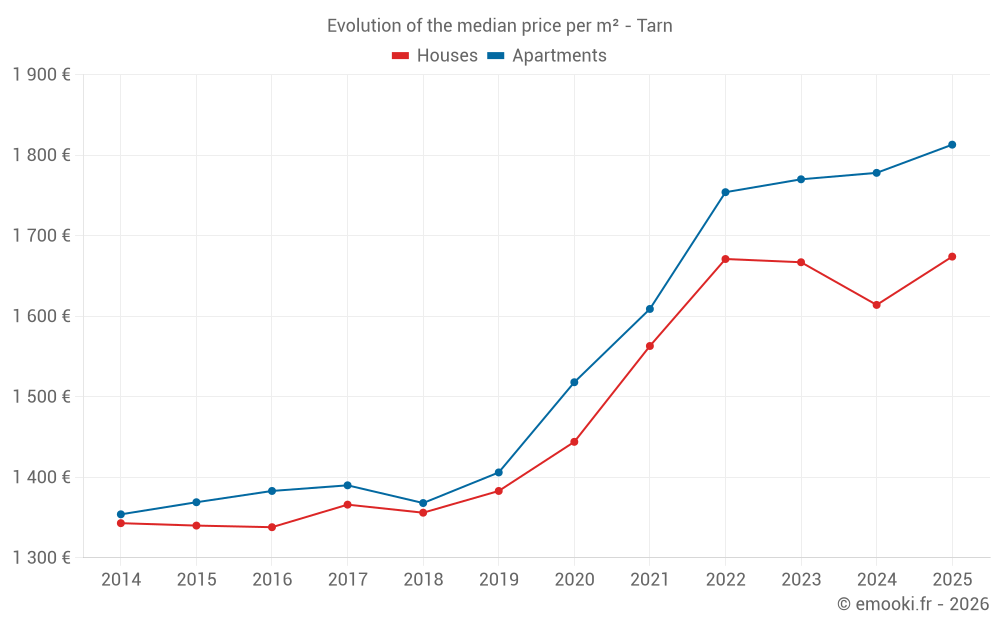
Houses
1 540 € /m²
Reliability 10/10
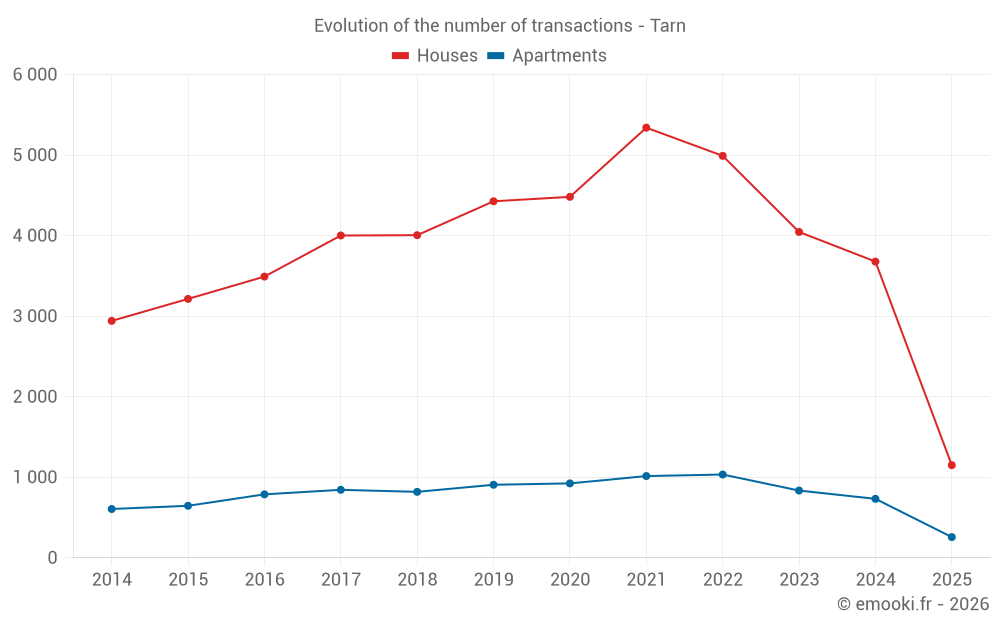
Median price on the 215 transactions of the last 3 months.
from 883 to
2 243 € /m²
2 243 € /m²
60% of transactions from the 2nd to the 8th deciles.
Apartments
1 813 € /m²
Reliability 9/10
Median price on the 257 transactions of the last 6 months.
from 1 101 to
2 490 € /m²
2 490 € /m²
60% of transactions from the 2nd to the 8th deciles.
Dwellings
1 572 € /m²
Reliability 10/10
Median price on the 260 transactions of the last 3 months.
from 897 to
2 272 € /m²
2 272 € /m²
60% of transactions from the 2nd to the 8th deciles.