emooki
HomePrice mapTransactions
🇬🇧 English🇫🇷 Français🇩🇪 Deutsch🇪🇸 Español🇮🇹 Italiano

Real estate price map


Real estate price map in the municipality of Castres, choose a section to see transactions by parcel.

Tarn (81)

Castres - Real estate price m²

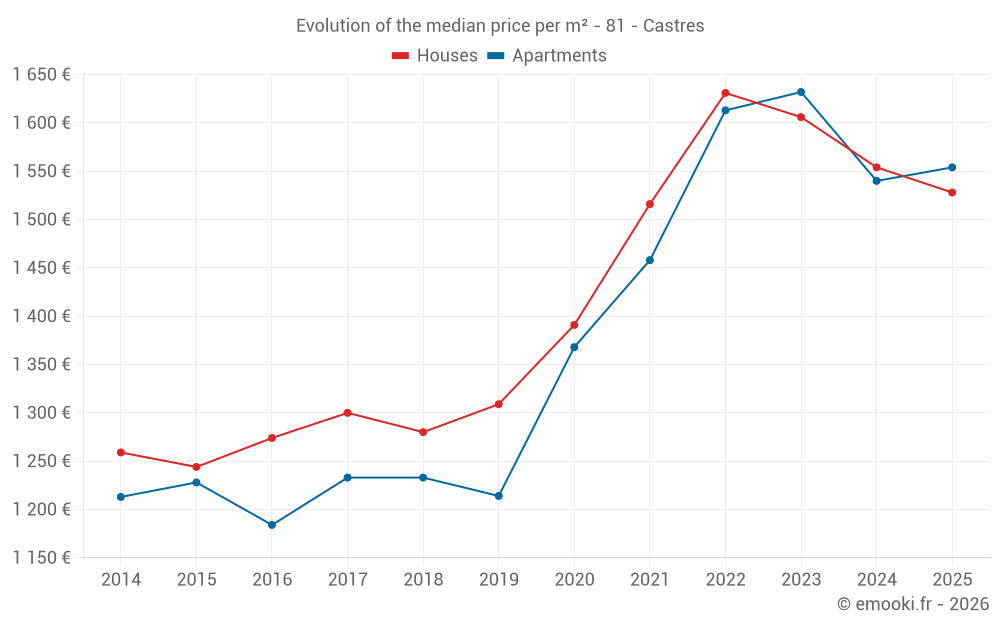
Median price of real estate
in the municipality of Castres

HousesHouses
1 474  /m²
1-23-45-67-89-10
Reliability 10/10
Median price on the 27 transactions of the last 3 months.
from 986 to
2 080  /m²
60% of transactions from the 2nd to the 8th deciles.
ApartmentsApartments
1 554  /m²
1-23-45-67-89-10
Reliability 9/10
Median price on the 50 transactions of the last 6 months.
from 1 149 to
2 036  /m²
60% of transactions from the 2nd to the 8th deciles.
DwellingsDwellings
1 403  /m²
1-23-45-67-89-10
Reliability 10/10
Median price on the 37 transactions of the last 3 months.
from 986 to
2 081  /m²
60% of transactions from the 2nd to the 8th deciles.
HousesEvolution of the price per m² of houses since...
1 year
-1.7%
2 years
-4.9%
3 years
-6.3%
4 years
+0.8%
5 years
+10%
6 years
+17%
7 years
+19%
8 years
+18%
9 years
+20%
10 years
+23%
11 years
+21%
The price per m² of houses has decreased by 6.3% since 3 years, but it has increased by 23% in 10 years.
ApartmentsEvolution of the price per m² of apartments since...
1 year
+0.9%
2 years
-4.8%
3 years
-3.7%
4 years
+6.6%
5 years
+14%
6 years
+28%
7 years
+26%
8 years
+26%
9 years
+31%
10 years
+27%
11 years
+28%
The price per m² of apartments has decreased by 4.8% since 2 years, but it has increased by 31% in 9 years.

Yearly evolution

Evolution of the median price per m²

Evolution of the median price per m² - 81 - Castres

Evolution of the number of transactions

Warning, last year incomplete. Projections made based on the proportions between semesters of the previous year at the departmental/national level and by type of property.

Evolution of the number of transactions - 81 - Castres

Yearly data

Descending order
Year
Houses
house
transactions
Houses
house
Price per m²
Apartments
apt.
transactions
Apartments
apt.
Price per m²
2025
107
1 528 
50
1 554 
2024
349
1 554 
172
1 540 
2023
378
1 606 
190
1 632 
2022
460
1 631 
234
1 613 
2021
508
1 516 
231
1 458 
2020
431
1 391 
198
1 368 
2019
439
1 309 
212
1 214 
2018
444
1 280 
183
1 233 
2017
399
1 300 
185
1 233 
2016
336
1 274 
172
1 184 
2015
332
1 244 
140
1 228 
2014
293
1 259 
165
1 213 

Analysis

Structure of prices per m²

Values of price percentiles per m² over the periods used for the estimated price of each type of property.

Structure of transaction amounts

Values of transaction amounts percentiles over the periods used for the estimated price of each type of property.

Transaction amounts and prices per m² by percentile

Ascending order
Percentile
Houses
house
Price per m²
Houses
house
Transaction amount
Apartments
apt.
Price per m²
Apartments
apt.
Transaction amount
10th percentile
938 
89 800 
971 
38 350 
20th percentile
986 
98 400 
1 149 
43 720 
30th percentile
1 185 
108 K
1 246 
61 624 
40th percentile
1 297 
121 K
1 383 
68 000 
50th percentile
1 474 
140 K
1 554 
78 500 
60th percentile
1 640 
166 K
1 809 
88 720 
70th percentile
1 763 
188 K
1 987 
103 K
80th percentile
2 080 
240 K
2 036 
118 K
90th percentile
2 548 
318 K
2 112 
141 K

National and departmental comparison

Evolution of the median price per m² of houses

Evolution of the median price per m² of apartments

Quarterly evolution

Evolution of the median price per m²

Evolution of the number of transactions

Quarterly data

Descending order
Quarter
Houses
house
transactions
Houses
house
Price per m²
Apartments
apt.
transactions
Apartments
apt.
Price per m²
2025 Q2
27
1 474 
10
1 276 
2025 Q1
80
1 598 
40
1 592 
2024 Q4
95
1 551 
44
1 506 
2024 Q3
95
1 623 
41
1 685 
2024 Q2
87
1 451 
42
1 580 
2024 Q1
72
1 602 
45
1 481 
2023 Q4
92
1 482 
39
1 615 
2023 Q3
96
1 707 
52
1 693 
2023 Q2
88
1 672 
51
1 595 
2023 Q1
102
1 542 
48
1 644 
2022 Q4
120
1 516 
57
1 648 
2022 Q3
141
1 705 
68
1 684 
2022 Q2
102
1 588 
57
1 571 
2022 Q1
97
1 564 
52
1 535 
2021 Q4
127
1 495 
55
1 443 
2021 Q3
140
1 729 
59
1 552 
2021 Q2
134
1 424 
72
1 466 
2021 Q1
107
1 414 
45
1 326 
2020 Q4
116
1 482 
54
1 302 
2020 Q3
124
1 378 
49
1 361 
2020 Q2
81
1 340 
51
1 420 
2020 Q1
110
1 355 
44
1 366 
2019 Q4
96
1 322 
56
1 249 
2019 Q3
136
1 334 
55
1 300 
2019 Q2
118
1 208 
51
1 158 
2019 Q1
89
1 322 
50
1 190 
2018 Q4
103
1 331 
49
1 233 
2018 Q3
140
1 362 
62
1 249 
2018 Q2
109
1 195 
38
1 253 
2018 Q1
92
1 224 
34
1 168 
2017 Q4
100
1 319 
35
1 212 
2017 Q3
109
1 292 
45
1 223 
2017 Q2
105
1 217 
51
1 296 
2017 Q1
85
1 339 
54
1 148 
2016 Q4
79
1 310 
45
1 129 
2016 Q3
113
1 314 
57
1 136 
2016 Q2
92
1 280 
38
1 248 
2016 Q1
52
1 114 
32
1 244 
2015 Q4
100
1 234 
36
1 229 
2015 Q3
85
1 250 
40
1 226 
2015 Q2
71
1 181 
29
1 164 
2015 Q1
76
1 264 
35
1 230 
2014 Q4
79
1 332 
37
1 135 
2014 Q3
79
1 297 
49
1 219 
2014 Q2
71
1 250 
40
1 284 
2014 Q1
64
1 212 
39
1 138 

Overview of the latest real estate transactions

The following list is an anonymized overview of the latest transactions. For more details and to find all transactions, please use the map to view transactions by plot or the transaction search page for a search by criteria.

2025-06-27
367 500 
1 107  /m²(332 m²)
1 436  /m²(256 m²)
Sale
Apartments
Apartment
2 rooms
45 m2
Apartments
Apartment
3 rooms
73 m2
Apartments
Apartment
2 rooms
33 m2
Apartments
Apartment
2 rooms
32 m2
Apartments
Apartment
3 rooms
73 m2
Commercial property
56 m2
Commercial property
20 m2
5 outbuildings
Land
143 m2
-Sols
2025-06-25
25 000 
676  /m²(37 m²)
Sale
Apartments
Apartment
2 rooms
37 m2
1 outbuilding
2025-06-24
59 000 
843  /m²(70 m²)
Sale
Commercial property
70 m2
2025-06-20
61 000 
1 386  /m²(44 m²)
Sale
Apartments
Apartment
2 rooms
44 m2
2025-06-20
52 000 
912  /m²(57 m²)
Sale
Apartments
Apartment
2 rooms
57 m2
2025-06-20
140 000 
1 273  /m²(110 m²)
Sale
Houses
House
5 rooms
110 m2
Land
148 m2
-Sols
2025-06-19
541 500 
3 787  /m²(143 m²)
Sale
Houses
House
6 rooms
143 m2
4 outbuildings
Land
2436 m2
-Terrains d'agrément
/Parc
Land
500 m2
-Sols
Land
2 m2
-Terres
Land
473 m2
-Terres
2025-06-19
110 000 
1 038  /m²(106 m²)
Sale
Houses
House
5 rooms
106 m2
1 outbuilding
Land
130 m2
-Sols
Land
3210 m2
-Terres
Land
300 m2
-Sols
2025-06-17
3 000 
Sale
Land
190 m2
-Jardins
/Jardin potager
2025-06-17
220 000 
2 222  /m²(99 m²)
Sale
Houses
House
4 rooms
99 m2
Land
746 m2
-Sols
2025-06-14
75 000 
Sale
Land
1020 m2
-Terrains à bâtir
2025-06-13
150 000 
600  /m²(250 m²)
Sale
Commercial property
50 m2
Commercial property
200 m2
Land
220 m2
-Sols
2025-06-06
895 000 
2 983  /m²(300 m²)
Sale
Houses
House
9 rooms
300 m2
Land
1000 m2
-Sols
Land
2327 m2
-Taillis simples
Land
9152 m2
-Taillis simples
Land
693 m2
-Taillis simples
Land
528 m2
-Terres
Land
4114 m2
-Taillis simples
Land
24 m2
-Terres
Land
138 m2
-Terres
Land
454 m2
-Terres
2025-06-05
140 000 
1 474  /m²(95 m²)
Sale
Houses
House
4 rooms
95 m2
Land
1033 m2
-Sols
2025-05-28
187 000 
1 571  /m²(119 m²)
Sale
Houses
House
4 rooms
119 m2
Land
899 m2
-Sols
2025-05-27
89 500 
952  /m²(94 m²)
Sale
Houses
House
5 rooms
94 m2
Land
243 m2
-Sols
2025-05-27
113 550 
692  /m²(164 m²)
Sale
Land
185 m2
-Sols
Commercial property
164 m2
2025-05-27
307 000 
903  /m²(340 m²)
Sale
Houses
House
7 rooms
340 m2
1 outbuilding
Land
1395 m2
-Sols
Land
4800 m2
-Terrains d'agrément
/Parc
2025-05-22
335 724 
2 098  /m²(160 m²)
Sale
Houses
House
6 rooms
160 m2
Land
210 m2
-Sols
2025-05-21
245 000 
2 606  /m²(94 m²)
Sale
Houses
House
3 rooms
94 m2
1 outbuilding
Land
622 m2
-Sols
Land
578 m2
-Jardins
/Jardin potager
8983 transactions listed in the municipality

Tarn (81)

Most expensive cities

City
name
Descending orderHouses
house
Price per m²
2 699 
2 600 
2 578 
2 560 
2 528 
2 507 
2 469 
2 442 
City
name
Descending orderApartments
apt.
Price per m²
2 455 
2 149 
2 091 
1 935 
1 823 
1 810 
1 807 

Least expensive cities

City
name
Ascending orderHouses
house
Price per m²
487 
505 
521 
632 
660 
660 
City
name
Ascending orderApartments
apt.
Price per m²
61 
133 
181 
222 
267