emooki
HomePrice mapTransactions
🇬🇧 English🇫🇷 Français🇩🇪 Deutsch🇪🇸 Español🇮🇹 Italiano

Real estate price map


Real estate price map in the municipality of Soual, choose a section to see transactions by parcel.

Tarn (81)

Soual - Real estate price m²

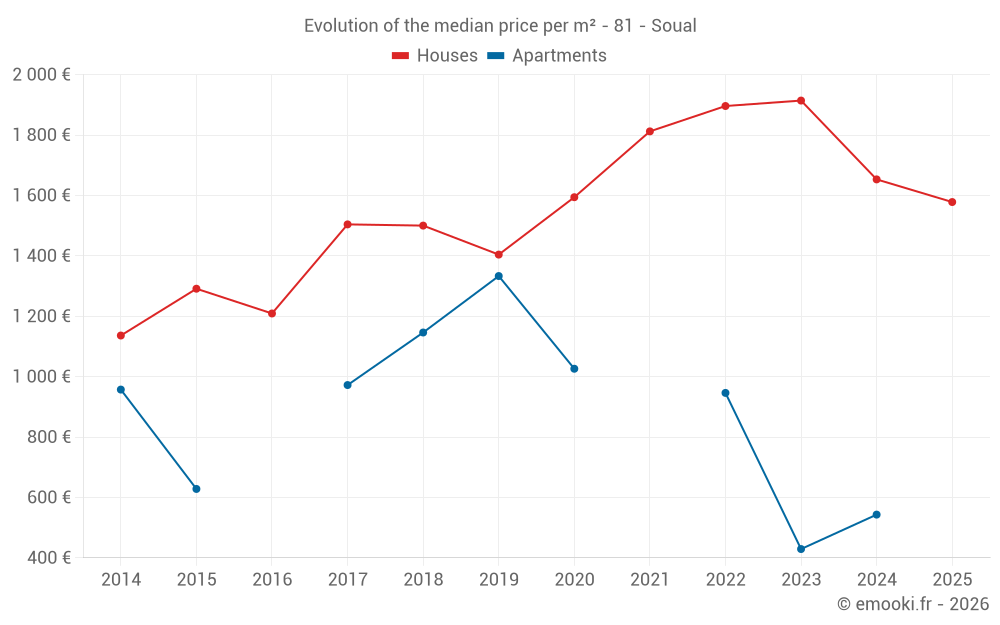
Median price of real estate
in the municipality of Soual

HousesHouses
1 644  /m²
1-23-45-67-89-10
Reliability 8/10
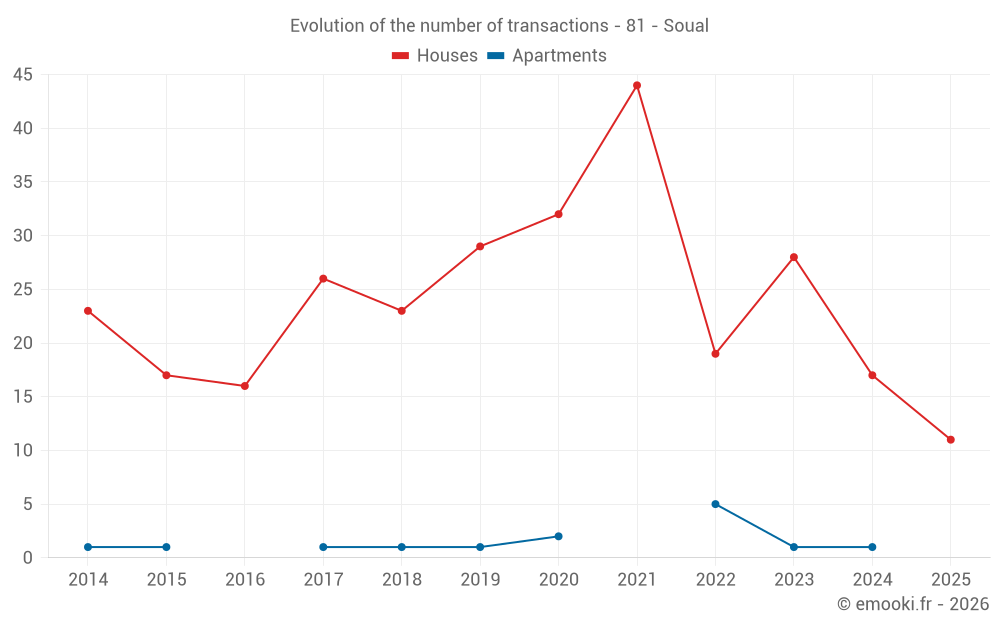
Median price on the 22 transactions of the last 12 months.
from 1 039 to
2 279  /m²
60% of transactions from the 2nd to the 8th deciles.
ApartmentsApartments
859  /m²
1-23-45-67-89-10
Reliability 4/10
Median price on the 9 transactions of the last 60 months.
DwellingsDwellings
1 638  /m²
1-23-45-67-89-10
Reliability 8/10
Median price on the 23 transactions of the last 12 months.
from 880 to
2 246  /m²
60% of transactions from the 2nd to the 8th deciles.
HousesEvolution of the price per m² of houses since...
1 year
-4.5%
2 years
-18%
3 years
-17%
4 years
-13%
5 years
-1%
6 years
+12%
7 years
+5.2%
8 years
+4.9%
9 years
+31%
10 years
+22%
11 years
+39%
The price per m² of houses has decreased by 18% since 2 years, but it has increased by 39% in 11 years.

Yearly evolution

Evolution of the median price per m²

Evolution of the median price per m² - 81 - Soual

Evolution of the number of transactions

Warning, last year incomplete. Projections made based on the proportions between semesters of the previous year at the departmental/national level and by type of property.

Evolution of the number of transactions - 81 - Soual

Yearly data

Descending order
Year
Houses
house
transactions
Houses
house
Price per m²
Apartments
apt.
transactions
Apartments
apt.
Price per m²
2025
11
1 578 
0
--- 
2024
17
1 653 
1
543 
2023
28
1 914 
1
429 
2022
19
1 896 
5
946 
2021
44
1 812 
0
--- 
2020
32
1 594 
2
1 026 
2019
29
1 404 
1
1 333 
2018
23
1 500 
1
1 146 
2017
26
1 504 
1
972 
2016
16
1 209 
0
--- 
2015
17
1 291 
1
628 
2014
23
1 136 
1
957 

Analysis

Structure of prices per m²

Values of price percentiles per m² over the periods used for the estimated price of each type of property.

Structure of transaction amounts

Values of transaction amounts percentiles over the periods used for the estimated price of each type of property.

Transaction amounts and prices per m² by percentile

Ascending order
Percentile
Houses
house
Price per m²
Houses
house
Transaction amount
Apartments
apt.
Price per m²
Apartments
apt.
Transaction amount
10th percentile
760 
78 500 
468 
60 880 
20th percentile
1 039 
120 K
517 
65 940 
30th percentile
1 470 
146 K
664 
70 500 
40th percentile
1 535 
154 K
849 
79 000 
50th percentile
1 644 
171 K
859 
95 000 
60th percentile
1 837 
184 K
929 
107 K
70th percentile
1 999 
191 K
946 
118 K
80th percentile
2 279 
232 K
1 050 
147 K
90th percentile
2 474 
240 K
1 214 
196 K

National and departmental comparison

Evolution of the median price per m² of houses

Evolution of the median price per m² of apartments

Quarterly evolution

Evolution of the median price per m²

Evolution of the number of transactions

Quarterly data

Descending order
Quarter
Houses
house
transactions
Houses
house
Price per m²
Apartments
apt.
transactions
Apartments
apt.
Price per m²
2025 Q2
2
1 470 
0
--- 
2025 Q1
9
1 920 
0
--- 
2024 Q4
5
1 507 
0
--- 
2024 Q3
6
1 733 
1
543 
2024 Q2
3
1 653 
0
--- 
2024 Q1
3
2 000 
0
--- 
2023 Q4
9
1 711 
0
--- 
2023 Q3
3
2 015 
0
--- 
2023 Q2
6
2 096 
1
429 
2023 Q1
10
1 988 
0
--- 
2022 Q4
3
1 529 
2
864 
2022 Q3
6
1 978 
2
946 
2022 Q2
4
1 632 
1
859 
2022 Q1
6
1 995 
0
--- 
2021 Q4
6
1 833 
0
--- 
2021 Q3
13
1 974 
0
--- 
2021 Q2
14
1 525 
0
--- 
2021 Q1
11
1 849 
0
--- 
2020 Q4
5
1 885 
2
1 026 
2020 Q3
14
1 642 
0
--- 
2020 Q2
5
1 281 
0
--- 
2020 Q1
8
1 285 
0
--- 
2019 Q4
6
1 852 
1
1 333 
2019 Q3
9
1 100 
0
--- 
2019 Q2
8
1 553 
0
--- 
2019 Q1
6
1 157 
0
--- 
2018 Q4
4
1 596 
0
--- 
2018 Q3
6
1 480 
0
--- 
2018 Q2
6
1 589 
0
--- 
2018 Q1
7
1 417 
1
1 146 
2017 Q4
9
1 218 
0
--- 
2017 Q3
7
1 528 
1
972 
2017 Q2
6
1 707 
0
--- 
2017 Q1
4
1 930 
0
--- 
2016 Q4
6
1 292 
0
--- 
2016 Q3
6
1 117 
0
--- 
2016 Q2
2
1 173 
0
--- 
2016 Q1
2
1 530 
0
--- 
2015 Q4
4
1 140 
0
--- 
2015 Q3
6
1 300 
0
--- 
2015 Q2
3
975 
0
--- 
2015 Q1
4
1 452 
1
628 
2014 Q4
9
1 346 
0
--- 
2014 Q3
5
1 042 
0
--- 
2014 Q2
6
1 110 
0
--- 
2014 Q1
3
318 
1
957 

Overview of the latest real estate transactions

The following list is an anonymized overview of the latest transactions. For more details and to find all transactions, please use the map to view transactions by plot or the transaction search page for a search by criteria.

2025-04-29
150 000 
1 471  /m²(102 m²)
Sale
Houses
House
5 rooms
102 m2
Land
670 m2
-Sols
2025-04-29
235 000 
1 469  /m²(160 m²)
Sale
Houses
House
6 rooms
160 m2
Land
238 m2
-Sols
Land
158 m2
-Jardins
/Jardin potager
2025-04-17
60 000 
496  /m²(121 m²)
1 463  /m²(41 m²)
Sale
Houses
House
3 rooms
41 m2
Commercial property
80 m2
Land
66 m2
-Sols
2025-03-28
115 000 
846  /m²(136 m²)
Sale
Houses
House
5 rooms
136 m2
1 outbuilding
Land
198 m2
-Sols
Land
135 m2
-Sols
2025-03-28
1 006 100 
Sale
Land
1853 m2
-Sols
2025-03-26
161 000 
1 578  /m²(102 m²)
Sale
Houses
House
5 rooms
102 m2
Land
500 m2
-Sols
Land
1607 m2
-Jardins
/Jardin potager
Land
4 m2
-Sols
2025-03-25
275 000 
2 311  /m²(119 m²)
Sale
Houses
House
5 rooms
119 m2
1 outbuilding
Land
500 m2
-Sols
Land
350 m2
-Terrains d'agrément
/Parc
2025-03-14
48 000 
Sale
Land
411 m2
-Terrains d'agrément
/Parc
Land
509 m2
-Sols
2025-03-13
191 500 
2 487  /m²(77 m²)
Sale
Houses
House
2 rooms
77 m2
Land
500 m2
-Sols
Land
47 m2
-Terrains d'agrément
/Parc
2025-03-07
144 000 
2 361  /m²(61 m²)
Sale
Houses
House
3 rooms
61 m2
Land
483 m2
-Sols
2025-03-04
185 000 
2 033  /m²(91 m²)
Sale
Houses
House
5 rooms
91 m2
Land
552 m2
-Sols
2025-02-26
153 331 
Sale
Land
406 m2
-Terres
Land
981 m2
-Prés
Land
877 m2
-Prés
Land
721 m2
-Prés
Land
681 m2
-Prés
Land
763 m2
-Prés
Land
977 m2
-Prés
Land
716 m2
-Prés
Land
868 m2
-Prés
Land
2028 m2
-Prés
Land
533 m2
-Terres
Land
279 m2
-Terres
Land
136 m2
-Terres
Land
1 m2
-Terres
2025-02-25
80 669 
Sale
Land
626 m2
-Prés
Land
728 m2
-Prés
Land
602 m2
-Prés
Land
572 m2
-Prés
Land
645 m2
-Prés
Land
658 m2
-Prés
Land
810 m2
-Prés
Land
170 m2
-Prés
Land
304 m2
-Prés
Land
20 m2
-Prés
Land
82 m2
-Prés
Land
1 m2
-Prés
2025-02-17
239 970 
1 920  /m²(125 m²)
Sale
Houses
House
5 rooms
125 m2
Land
3490 m2
-Terrains d'agrément
/Parc
Land
600 m2
-Sols
2025-02-11
97 606 
Sale
Land
4032 m2
-Terres
Land
8235 m2
-Terres
Land
3400 m2
-Prés
Land
3850 m2
-Prés
Land
3652 m2
-Prés
Land
649 m2
-Landes
/Friche
Land
1014 m2
-Jardins
/Jardin potager
Land
3710 m2
-Prés
Land
3309 m2
-Prés
Land
661 m2
-Prés
Land
2987 m2
-Prés
Land
1917 m2
-Prés
Land
548 m2
-Prés
Land
4456 m2
-Terres
Land
4902 m2
-Terres
Land
205 m2
-Jardins
/Jardin potager
Land
2077 m2
-Terres
Land
5341 m2
-Prés
Land
895 m2
-Landes
/Friche
Land
9398 m2
-Prés
Land
1540 m2
-Prés
Land
12400 m2
-Prés
Land
10810 m2
-Terres
Land
2800 m2
-Prés
Land
1640 m2
-Taillis simples
2025-02-07
130 654 
Sale
Land
36 m2
-Sols
Land
440 m2
-Terres
Land
1500 m2
-Sols
Land
6454 m2
-Prés
Land
3262 m2
-Sols
Land
168 m2
-Sols
Land
907 m2
-Terrains d'agrément
/Parc
Land
500 m2
-Sols
2025-02-06
32 000 
508  /m²(63 m²)
Sale
Houses
House
3 rooms
63 m2
Land
45 m2
-Sols
2025-01-29
75 000 
750  /m²(100 m²)
Sale
Houses
House
5 rooms
100 m2
Land
244 m2
-Sols
Land
535 m2
-Jardins
/Jardin potager
Land
502 m2
-Jardins
/Jardin potager
Land
280 m2
-Sols
2025-01-28
400 000 
1 333  /m²(300 m²)
Sale
Commercial property
300 m2
Land
2103 m2
-Sols
2024-12-20
70 000 
Sale
Land
1355 m2
-Prés
543 transactions listed in the municipality

Tarn (81)

Most expensive cities

City
name
Descending orderHouses
house
Price per m²
2 699 
2 600 
2 578 
2 560 
2 528 
2 507 
2 469 
2 442 
City
name
Descending orderApartments
apt.
Price per m²
2 455 
2 149 
2 091 
1 935 
1 823 
1 810 
1 807 

Least expensive cities

City
name
Ascending orderHouses
house
Price per m²
487 
505 
521 
632 
660 
660 
City
name
Ascending orderApartments
apt.
Price per m²
61 
133 
181 
222 
267