Real estate price map
Real estate price map in the municipality of Labastide-Rouairoux, choose a section to see transactions by parcel.
Tarn (81)
Price per m² in Labastide-Rouairoux
Median price of real estate
in the municipality of Labastide-Rouairoux
Houses
848 € /m²
Reliability 9/10
Median price on the 20 transactions of the last 6 months.
from 273 to
1 141 € /m²
1 141 € /m²
60% of transactions from the 2nd to the 8th deciles.
Apartments
434 € /m²
Reliability 4/10
Median price on the 8 transactions of the last 60 months.
Dwellings
848 € /m²
Reliability 9/10
Median price on the 20 transactions of the last 6 months.
from 273 to
1 141 € /m²
1 141 € /m²
60% of transactions from the 2nd to the 8th deciles.
Evolution of the price per m² of houses since...
1 year
-16%
2 years
-28%
3 years
-2.2%
4 years
-25%
5 years
-10%
6 years
+8%
7 years
-5.7%
8 years
-9.4%
9 years
-14%
10 years
-4.9%
11 years
+3.9%
The price per m² of houses has decreased by 28% since 2 years, but it has increased by 8% in 6 years.
588 transactions listed in the municipality
Yearly data
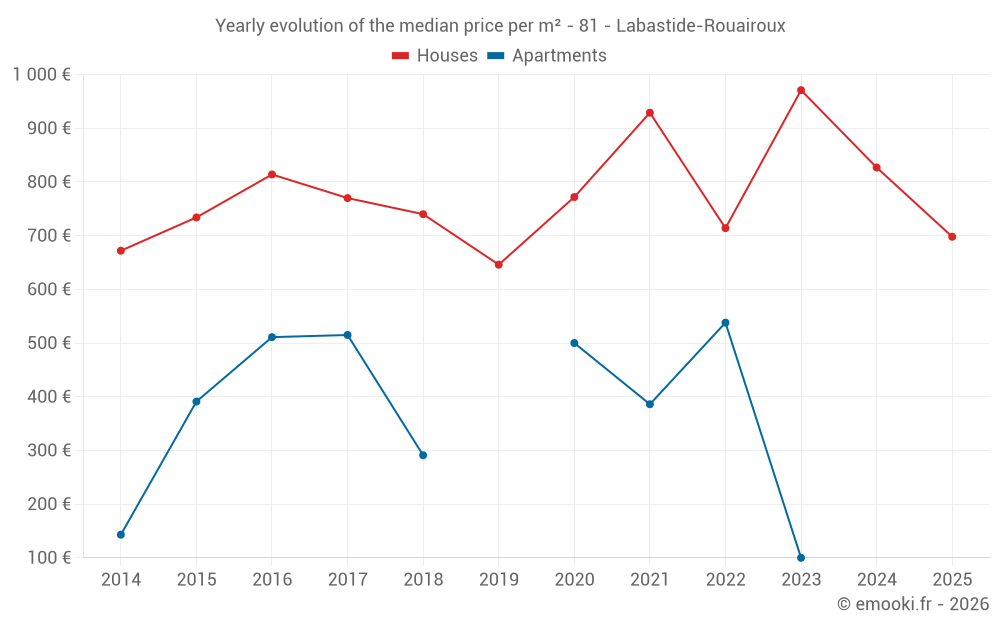
Yearly evolution of the median price per m²
Yearly evolution of the number of transactions

Yearly table
Year
house
transactions
transactions
house
Price per m²
Price per m²
apt.
transactions
transactions
apt.
Price per m²
Price per m²
2025
36
698 €
0
--- €
2024
37
827 €
0
--- €
2023
33
971 €
1
100 €
2022
49
714 €
5
538 €
2021
41
929 €
2
386 €
2020
38
772 €
3
500 €
2019
26
646 €
0
--- €
2018
22
740 €
2
291 €
2017
16
770 €
2
515 €
2016
16
814 €
1
511 €
2015
24
734 €
1
391 €
2014
28
672 €
1
143 €
Analysis
Structure of prices per m²
Values of price percentiles per m² over the periods used for the estimated price of each type of property.
Structure of transaction amounts
Values of transaction amounts percentiles over the periods used for the estimated price of each type of property.
Transaction amounts and prices per m² by percentile
Percentile
house
Price per m²
Price per m²
house
Transaction amount
Transaction amount
apt.
Price per m²
Price per m²
apt.
Transaction amount
Transaction amount
10th percentile
175 €
11 800 €
162 €
23 400 €
20th percentile
273 €
25 945 €
218 €
30 200 €
30th percentile
593 €
37 390 €
270 €
35 700 €
40th percentile
648 €
50 600 €
317 €
40 600 €
50th percentile
848 €
62 900 €
434 €
43 500 €
60th percentile
967 €
67 600 €
547 €
46 000 €
70th percentile
1 019 €
75 310 €
578 €
49 500 €
80th percentile
1 141 €
105 K€
602 €
58 700 €
90th percentile
1 349 €
127 K€
755 €
79 650 €
National and departmental comparison
Evolution of the median price per m² of houses
Evolution of the median price per m² of apartments
Quarterly data
Quarterly evolution of the median price per m²
Quarterly evolution of the number of transactions
Quarterly table
Quarter
house
transactions
transactions
house
Price per m²
Price per m²
apt.
transactions
transactions
apt.
Price per m²
Price per m²
2025 Q4
4
818 €
0
--- €
2025 Q3
16
848 €
0
--- €
2025 Q2
8
553 €
0
--- €
2025 Q1
8
502 €
0
--- €
2024 Q4
8
915 €
0
--- €
2024 Q3
15
612 €
0
--- €
2024 Q2
8
714 €
0
--- €
2024 Q1
6
1 190 €
0
--- €
2023 Q4
9
1 129 €
1
100 €
2023 Q3
9
615 €
0
--- €
2023 Q2
5
1 017 €
0
--- €
2023 Q1
10
1 048 €
0
--- €
2022 Q4
11
720 €
1
1 085 €
2022 Q3
13
767 €
2
576 €
2022 Q2
10
686 €
1
263 €
2022 Q1
15
625 €
1
331 €
2021 Q4
11
1 042 €
1
188 €
2021 Q3
10
720 €
1
583 €
2021 Q2
9
1 304 €
0
--- €
2021 Q1
11
836 €
0
--- €
2020 Q4
18
730 €
2
384 €
2020 Q3
13
810 €
0
--- €
2020 Q2
3
453 €
0
--- €
2020 Q1
4
716 €
1
538 €
2019 Q4
8
524 €
0
--- €
2019 Q3
5
721 €
0
--- €
2019 Q2
6
797 €
0
--- €
2019 Q1
7
633 €
0
--- €
2018 Q4
7
758 €
2
291 €
2018 Q3
7
750 €
0
--- €
2018 Q2
6
692 €
0
--- €
2018 Q1
2
2 364 €
0
--- €
2017 Q4
5
767 €
0
--- €
2017 Q3
4
604 €
1
255 €
2017 Q2
3
1 143 €
1
775 €
2017 Q1
4
380 €
0
--- €
2016 Q4
5
625 €
0
--- €
2016 Q3
1
270 €
0
--- €
2016 Q2
8
982 €
0
--- €
2016 Q1
2
828 €
1
511 €
2015 Q4
6
528 €
0
--- €
2015 Q3
10
924 €
0
--- €
2015 Q2
2
592 €
1
391 €
2015 Q1
6
621 €
0
--- €
2014 Q4
6
740 €
0
--- €
2014 Q3
6
571 €
1
143 €
2014 Q2
6
672 €
0
--- €
2014 Q1
10
617 €
0
--- €
Key takeaways
What is the price per m2 of houses in Labastide-Rouairoux?
The median price on the 20 house transactions of the last 6 months in the municipality of Labastide-Rouairoux was 848 € per square meter for a median property value of 62 900 €. Over this period, 60% of transactions were between 273 and 1 141 € per square meter (from the 2nd to the 8th deciles).
Compare with neighboring municipalities
City
name
name
house
Price per m²
Price per m²
apt.
Price per m²
Price per m²
City information
Zip code
- 81270 LABASTIDE ROUAIROUX