emooki
HomePrice mapTransactions
🇬🇧 English🇫🇷 Français🇩🇪 Deutsch🇪🇸 Español🇮🇹 Italiano

Real estate price map


Real estate price map in the municipality of Labruguière.

Tarn (81)
Labruguière

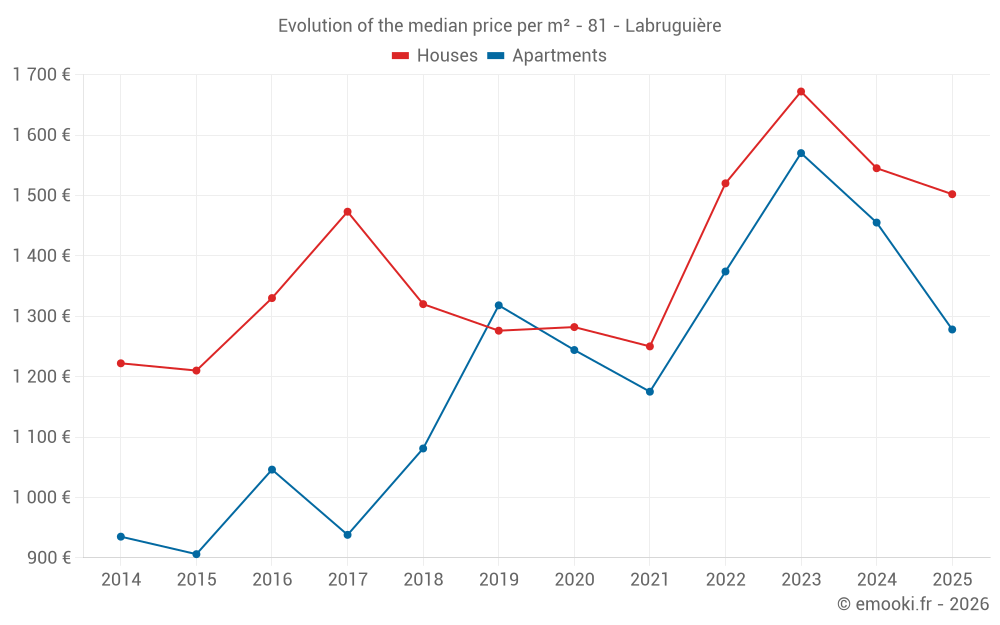
Median price of real estate
in the municipality of Labruguière

HousesHouses
1 502  /m²
1-23-45-67-89-10
Reliability 9/10
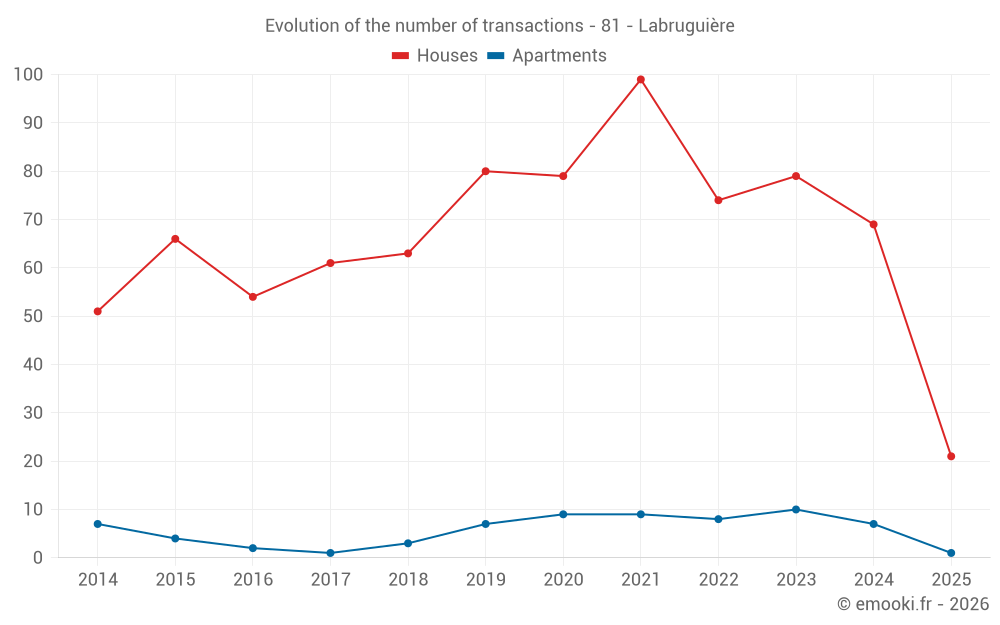
Median price on the 21 transactions of the last 6 months.
from 949 to
1 936  /m²
60% of transactions from the 2nd to the 8th deciles.
ApartmentsApartments
1 455  /m²
1-23-45-67-89-10
Reliability 6/10
Median price on the 23 transactions of the last 36 months.
from 1 096 to
1 682  /m²
60% of transactions from the 2nd to the 8th deciles.
DwellingsDwellings
1 482  /m²
1-23-45-67-89-10
Reliability 9/10
Median price on the 22 transactions of the last 6 months.
from 974 to
1 917  /m²
60% of transactions from the 2nd to the 8th deciles.
HousesEvolution of the price per m² of houses since...
1 year
-2.8%
2 years
-10%
3 years
-1.2%
4 years
+20%
5 years
+17%
6 years
+18%
7 years
+14%
8 years
+2%
9 years
+13%
10 years
+24%
11 years
+23%
ApartmentsEvolution of the price per m² of apartments since...
1 year
--
2 years
--
3 years
--
4 years
--
5 years
--
6 years
--
7 years
--
8 years
--
9 years
--
10 years
--
11 years
--

Yearly evolution

Evolution of the median price per m²

Evolution of the number of transactions

Warning, last year incomplete. Projections made based on the proportions between semesters of the previous year at the departmental/national level and by type of property.

Yearly data

Descending order
Year
Houses
house
transactions
Houses
house
Price per m²
Apartments
apt.
transactions
Apartments
apt.
Price per m²
2025
21
1 502 
1
1 278 
2024
69
1 545 
7
1 455 
2023
79
1 672 
10
1 570 
2022
74
1 520 
8
1 374 
2021
99
1 250 
9
1 175 
2020
79
1 282 
9
1 244 
2019
80
1 276 
7
1 318 
2018
63
1 320 
3
1 081 
2017
61
1 473 
1
938 
2016
54
1 330 
2
1 046 
2015
66
1 210 
4
906 
2014
51
1 222 
7
935 

Analysis

Structure of prices per m²

Values of price percentiles per m² over the periods used for the estimated price of each type of property.

Structure of transaction amounts

Values of transaction amounts percentiles over the periods used for the estimated price of each type of property.

Transaction amounts and prices per m² by percentile

Ascending order
Percentile
Houses
house
Price per m²
Houses
house
Transaction amount
Apartments
apt.
Price per m²
Apartments
apt.
Transaction amount
10th percentile
649 
50 000 
935 
43 600 
20th percentile
949 
85 000 
1 096 
55 300 
30th percentile
1 260 
92 000 
1 276 
61 000 
40th percentile
1 338 
115 K
1 381 
64 800 
50th percentile
1 502 
130 K
1 455 
67 000 
60th percentile
1 672 
137 K
1 532 
68 200 
70th percentile
1 691 
182 K
1 580 
78 000 
80th percentile
1 936 
195 K
1 682 
97 151 
90th percentile
2 216 
235 K
1 800 
164 K

National and departmental comparison

Evolution of the median price per m² of houses

Evolution of the median price per m² of apartments

Quarterly evolution

Evolution of the median price per m²

Evolution of the number of transactions

Quarterly data

Descending order
Quarter
Houses
house
transactions
Houses
house
Price per m²
Apartments
apt.
transactions
Apartments
apt.
Price per m²
2025 Q2
3
1 691 
1
1 278 
2025 Q1
18
1 400 
0
--- 
2024 Q4
22
1 704 
2
1 068 
2024 Q3
18
1 800 
1
1 757 
2024 Q2
12
1 444 
3
1 455 
2024 Q1
17
1 125 
1
1 811 
2023 Q4
19
1 492 
2
1 580 
2023 Q3
17
1 494 
2
1 134 
2023 Q2
22
1 790 
4
1 622 
2023 Q1
21
1 778 
2
1 556 
2022 Q4
18
1 585 
4
1 442 
2022 Q3
20
1 558 
1
1 386 
2022 Q2
19
1 360 
3
912 
2022 Q1
17
1 429 
0
--- 
2021 Q4
24
1 532 
1
1 098 
2021 Q3
23
1 365 
1
1 757 
2021 Q2
27
1 150 
4
1 248 
2021 Q1
25
1 118 
3
884 
2020 Q4
20
1 399 
2
800 
2020 Q3
20
1 240 
1
1 541 
2020 Q2
22
1 546 
2
1 416 
2020 Q1
17
1 026 
4
1 022 
2019 Q4
17
1 010 
3
1 250 
2019 Q3
24
1 468 
2
1 409 
2019 Q2
21
1 250 
0
--- 
2019 Q1
18
1 180 
2
994 
2018 Q4
17
1 159 
0
--- 
2018 Q3
18
1 534 
1
435 
2018 Q2
18
1 138 
2
1 186 
2018 Q1
10
1 384 
0
--- 
2017 Q4
14
1 558 
0
--- 
2017 Q3
19
1 283 
1
938 
2017 Q2
13
1 484 
0
--- 
2017 Q1
15
1 453 
0
--- 
2016 Q4
15
1 083 
0
--- 
2016 Q3
18
1 497 
0
--- 
2016 Q2
12
1 372 
2
1 046 
2016 Q1
9
792 
0
--- 
2015 Q4
16
1 095 
2
728 
2015 Q3
23
1 413 
0
--- 
2015 Q2
17
1 079 
2
1 035 
2015 Q1
10
1 030 
0
--- 
2014 Q4
12
1 291 
0
--- 
2014 Q3
16
1 180 
2
936 
2014 Q2
12
1 706 
2
775 
2014 Q1
11
882 
3
1 428 

Tarn (81)

Most expensive cities

City
name
Descending orderHouses
house
Price per m²
2 699 
2 600 
2 578 
2 560 
2 528 
2 507 
2 469 
2 442 
City
name
Descending orderApartments
apt.
Price per m²
2 455 
2 149 
2 091 
1 935 
1 823 
1 810 
1 807 

Least expensive cities

City
name
Ascending orderHouses
house
Price per m²
487 
505 
521 
632 
660 
660 
City
name
Ascending orderApartments
apt.
Price per m²
61 
133 
181 
222 
267