Median price of real estate
in the municipality of Saint-Thibault-des-Vignes
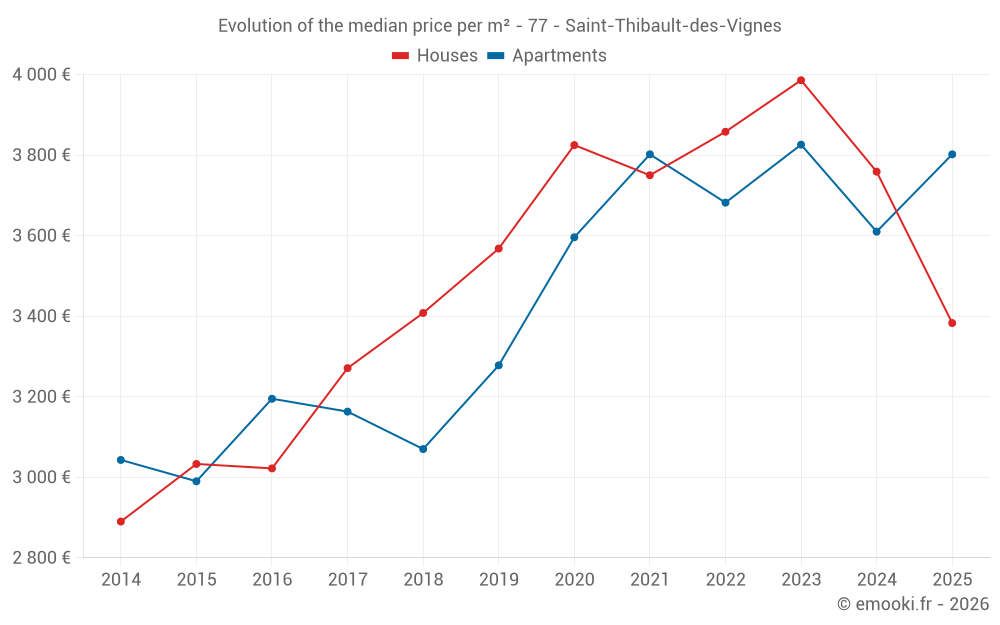
Houses
3 406 € /m²
Reliability 8/10
Median price on the 24 transactions of the last 12 months.
from 3 043 to
3 986 € /m²
3 986 € /m²
60% of transactions from the 2nd to the 8th deciles.
Apartments
3 621 € /m²
Reliability 7/10
Median price on the 37 transactions of the last 24 months.
from 3 201 to
4 073 € /m²
4 073 € /m²
60% of transactions from the 2nd to the 8th deciles.
Dwellings
3 554 € /m²
Reliability 9/10
Median price on the 20 transactions of the last 6 months.
from 3 268 to
4 040 € /m²
4 040 € /m²
60% of transactions from the 2nd to the 8th deciles.