Real estate price map
Real estate price map in the municipality of Paris 17e Arrondissement, choose a section to see transactions by parcel.
Paris (75)
Price per m² in Paris 17e Arrondissement
Median price of real estate
in the municipality of Paris 17e Arrondissement
Houses
13 526 € /m²
Reliability 6/10
Median price on the 16 transactions of the last 36 months.
from 12 000 to
17 907 € /m²
17 907 € /m²
60% of transactions from the 2nd to the 8th deciles.
Apartments
10 006 € /m²
Reliability 10/10
Median price on the 666 transactions of the last 3 months.
from 7 945 to
12 166 € /m²
12 166 € /m²
60% of transactions from the 2nd to the 8th deciles.
Dwellings
10 006 € /m²
Reliability 10/10
Median price on the 666 transactions of the last 3 months.
from 7 945 to
12 166 € /m²
12 166 € /m²
60% of transactions from the 2nd to the 8th deciles.
Evolution of the price per m² of houses since...
1 year
-28%
2 years
+13%
3 years
-13%
4 years
-4.5%
5 years
+20%
6 years
+9.3%
7 years
+17%
8 years
+44%
9 years
+46%
10 years
+30%
11 years
+49%
The price per m² of houses has decreased by 28% since 1 year, but it has increased by 49% in 11 years.
Evolution of the price per m² of apartments since...
1 year
+0.8%
2 years
-5.8%
3 years
-10%
4 years
-11%
5 years
-11%
6 years
-4.2%
7 years
+2.6%
8 years
+11%
9 years
+20%
10 years
+24%
11 years
+23%
The price per m² of apartments has decreased by 11% since 4 years, but it has increased by 24% in 10 years.
44180 transactions listed in the municipality
Yearly data
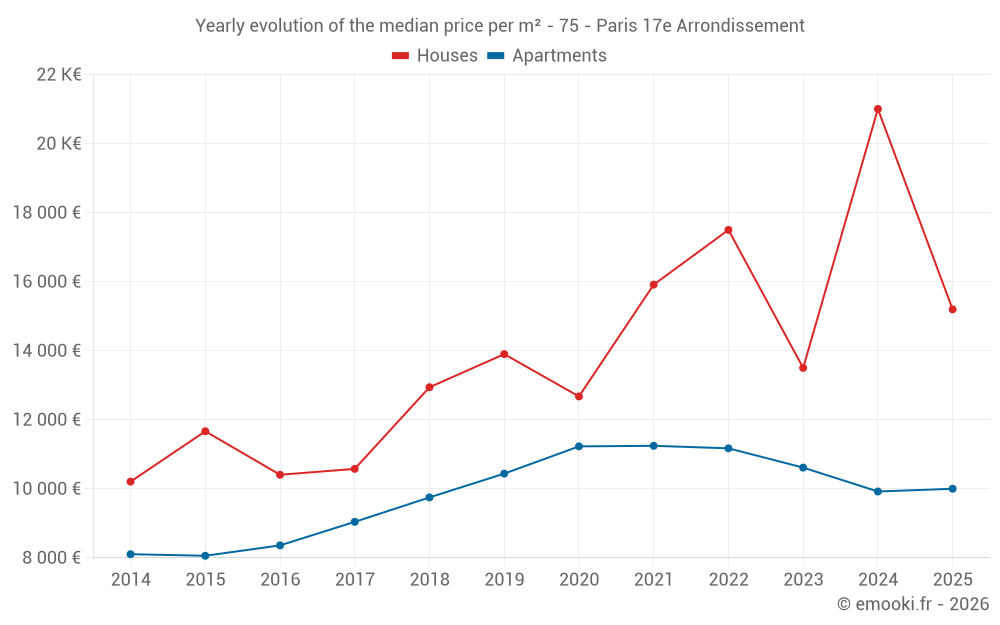
Yearly evolution of the median price per m²
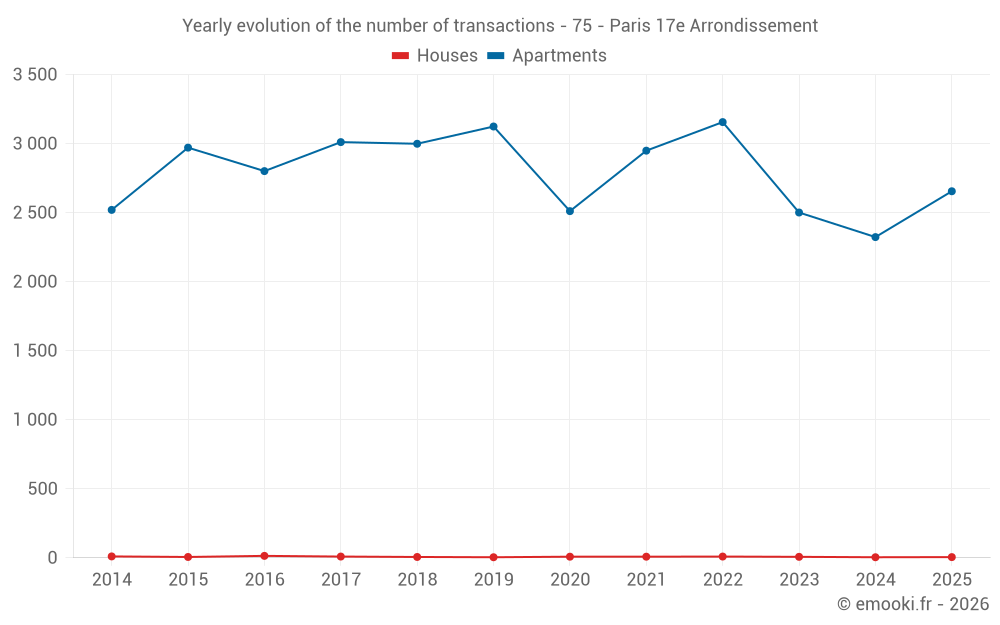
Yearly evolution of the number of transactions
Yearly table
Year
house
transactions
transactions
house
Price per m²
Price per m²
apt.
transactions
transactions
apt.
Price per m²
Price per m²
2025
5
15 198 €
2 655
10 000 €
2024
4
21 004 €
2 323
9 921 €
2023
7
13 502 €
2 501
10 613 €
2022
9
17 500 €
3 156
11 172 €
2021
8
15 915 €
2 949
11 245 €
2020
8
12 675 €
2 511
11 228 €
2019
4
13 901 €
3 124
10 439 €
2018
6
12 942 €
2 999
9 750 €
2017
9
10 577 €
3 011
9 042 €
2016
14
10 406 €
2 801
8 360 €
2015
6
11 666 €
2 971
8 059 €
2014
10
10 207 €
2 520
8 104 €
Analysis
Structure of prices per m²
Values of price percentiles per m² over the periods used for the estimated price of each type of property.
Structure of transaction amounts
Values of transaction amounts percentiles over the periods used for the estimated price of each type of property.
Transaction amounts and prices per m² by percentile
Percentile
house
Price per m²
Price per m²
house
Transaction amount
Transaction amount
apt.
Price per m²
Price per m²
apt.
Transaction amount
Transaction amount
10th percentile
5 766 €
135 K€
6 667 €
144 K€
20th percentile
12 000 €
608 K€
7 945 €
215 K€
30th percentile
12 562 €
1 180 K€
8 750 €
275 K€
40th percentile
13 077 €
1 450 K€
9 413 €
339 K€
50th percentile
13 526 €
1 849 K€
10 006 €
409 K€
60th percentile
15 198 €
2 380 K€
10 640 €
513 K€
70th percentile
16 744 €
2 517 K€
11 276 €
637 K€
80th percentile
17 907 €
2 728 K€
12 166 €
843 K€
90th percentile
24 682 €
5 293 K€
13 329 €
1 248 K€
National and departmental comparison
Evolution of the median price per m² of houses
Evolution of the median price per m² of apartments
Quarterly data
Quarterly evolution of the median price per m²
Quarterly evolution of the number of transactions
Quarterly table
Quarter
house
transactions
transactions
house
Price per m²
Price per m²
apt.
transactions
transactions
apt.
Price per m²
Price per m²
2025 Q4
0
--- €
666
10 006 €
2025 Q3
1
11 157 €
734
10 115 €
2025 Q2
0
--- €
571
9 836 €
2025 Q1
4
16 544 €
684
10 000 €
2024 Q4
1
375 €
543
9 862 €
2024 Q3
1
42 719 €
623
10 189 €
2024 Q2
2
21 004 €
646
9 807 €
2024 Q1
0
--- €
511
9 749 €
2023 Q4
2
14 550 €
569
10 000 €
2023 Q3
3
13 077 €
565
10 789 €
2023 Q2
0
--- €
687
10 732 €
2023 Q1
2
15 931 €
680
10 722 €
2022 Q4
4
15 978 €
735
10 942 €
2022 Q3
1
11 550 €
835
11 388 €
2022 Q2
2
16 000 €
876
11 092 €
2022 Q1
2
30 958 €
710
11 266 €
2021 Q4
0
--- €
722
11 264 €
2021 Q3
5
18 214 €
810
11 302 €
2021 Q2
2
13 515 €
774
11 048 €
2021 Q1
1
12 346 €
643
11 320 €
2020 Q4
3
10 105 €
723
11 250 €
2020 Q3
2
15 362 €
601
11 364 €
2020 Q2
1
6 186 €
522
11 292 €
2020 Q1
2
14 036 €
665
11 034 €
2019 Q4
0
--- €
820
10 629 €
2019 Q3
2
14 610 €
831
10 622 €
2019 Q2
2
13 647 €
769
10 244 €
2019 Q1
0
--- €
704
10 208 €
2018 Q4
1
14 010 €
760
9 947 €
2018 Q3
2
13 924 €
757
10 000 €
2018 Q2
2
13 495 €
785
9 622 €
2018 Q1
1
10 855 €
697
9 452 €
2017 Q4
2
11 000 €
706
9 220 €
2017 Q3
1
12 290 €
776
9 342 €
2017 Q2
3
10 577 €
787
8 833 €
2017 Q1
3
10 167 €
742
8 703 €
2016 Q4
3
10 370 €
677
8 571 €
2016 Q3
6
12 504 €
826
8 532 €
2016 Q2
3
7 198 €
778
8 205 €
2016 Q1
2
11 514 €
520
8 024 €
2015 Q4
2
8 988 €
884
8 117 €
2015 Q3
1
16 000 €
795
8 092 €
2015 Q2
2
11 242 €
694
8 031 €
2015 Q1
1
15 789 €
598
8 000 €
2014 Q4
2
7 114 €
620
7 984 €
2014 Q3
4
14 454 €
723
8 051 €
2014 Q2
3
3 247 €
593
8 182 €
2014 Q1
1
9 375 €
584
8 211 €
Key takeaways
What is the price per m2 of apartments in Paris 17e Arrondissement?
The median price on the 666 apartment transactions of the last 3 months in the municipality of Paris 17e Arrondissement was 10 006 € per square meter for a median property value of 409 120 €. Over this period, 60% of transactions were between 7 945 and 12 166 € per square meter (from the 2nd to the 8th deciles).
Compare with neighboring municipalities
City
name
name
house
Price per m²
Price per m²
apt.
Price per m²
Price per m²
City information
Zip code
- 75017 PARIS