emooki
HomePrice mapTransactions
🇬🇧 English🇫🇷 Français🇩🇪 Deutsch🇪🇸 Español🇮🇹 Italiano

Real estate price map


Real estate price map in the Paris department.

Department 75
Paris

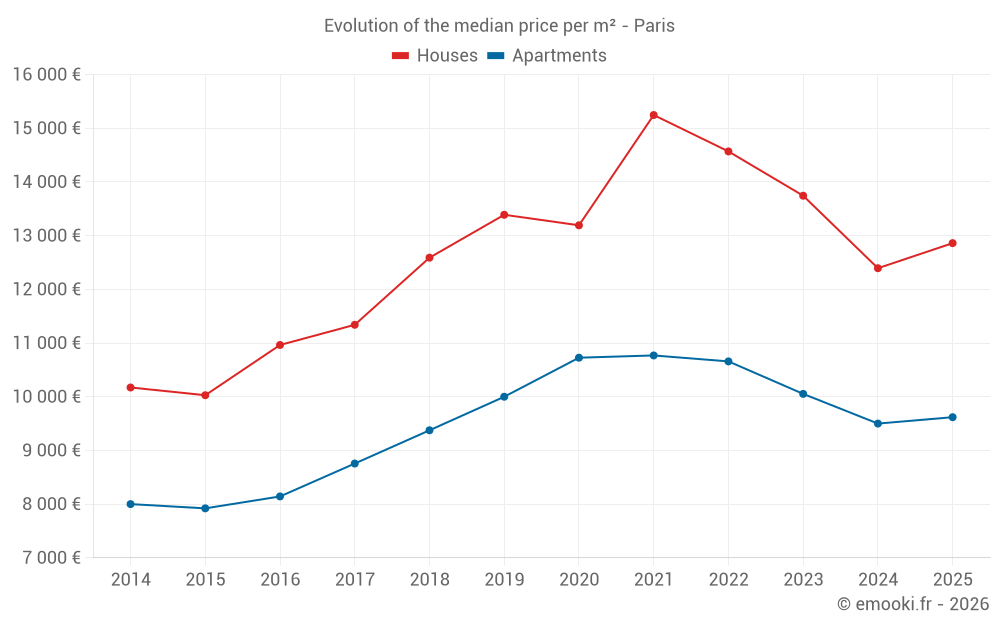
Median price of real estate
in the Paris department

HousesHouses
12 740 € /m²
1-23-45-67-89-10
Reliability 8/10
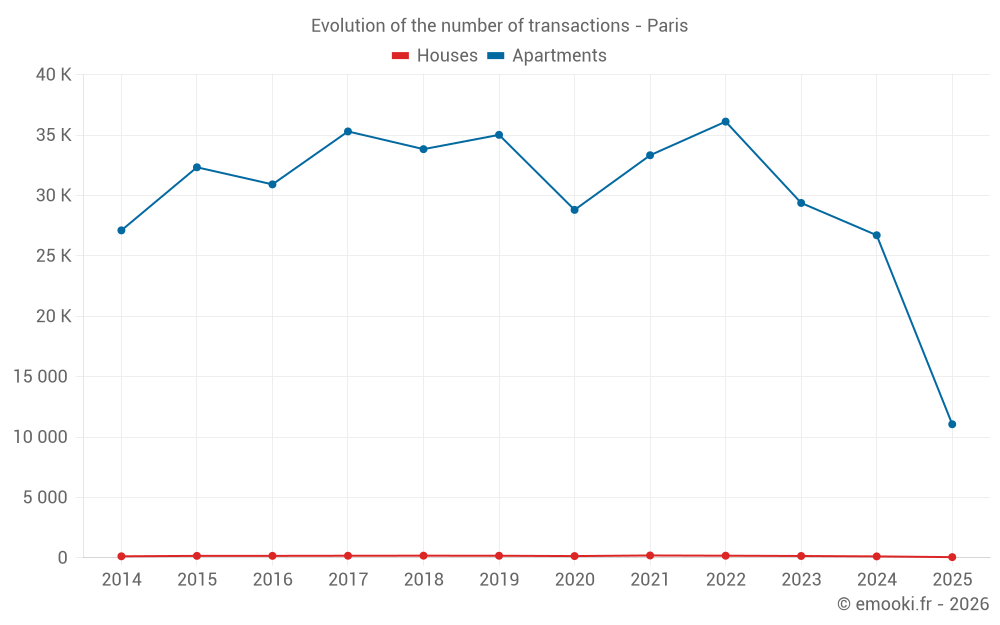
Median price on the 122 transactions of the last 12 months.
from 9 274 to
19 458 € /m²
60% of transactions from the 2nd to the 8th deciles.
ApartmentsApartments
9 744 € /m²
1-23-45-67-89-10
Reliability 10/10
Median price on the 2927 transactions of the last 3 months.
from 7 360 to
12 331 € /m²
60% of transactions from the 2nd to the 8th deciles.
DwellingsDwellings
9 744 € /m²
1-23-45-67-89-10
Reliability 10/10
Median price on the 2938 transactions of the last 3 months.
from 7 361 to
12 337 € /m²
60% of transactions from the 2nd to the 8th deciles.
HousesEvolution of the price per m² of houses since...
1 year
+3.8%
2 years
-6.4%
3 years
-12%
4 years
-16%
5 years
-2.5%
6 years
-3.9%
7 years
+2.2%
8 years
+13%
9 years
+17%
10 years
+28%
11 years
+26%
ApartmentsEvolution of the price per m² of apartments since...
1 year
+1.3%
2 years
-4.3%
3 years
-10%
4 years
-11%
5 years
-10%
6 years
-3.8%
7 years
+2.6%
8 years
+10%
9 years
+18%
10 years
+21%
11 years
+20%

Yearly evolution

Evolution of the median price per m²

Evolution of the number of transactions

Warning, last year incomplete. Projections made based on the proportions between semesters of the previous year at the departmental/national level and by type of property.

Yearly data

Descending order
Year
Houses
house
transactions
Houses
house
Price per m²
Apartments
apt.
transactions
Apartments
apt.
Price per m²
2025
55
12 861 €
11 055
9 619 €
2024
116
12 394 €
26 702
9 500 €
2023
150
13 744 €
29 374
10 053 €
2022
174
14 569 €
36 108
10 658 €
2021
193
15 247 €
33 325
10 769 €
2020
143
13 193 €
28 801
10 727 €
2019
170
13 389 €
35 013
10 000 €
2018
176
12 590 €
33 828
9 375 €
2017
170
11 340 €
35 296
8 756 €
2016
161
10 964 €
30 912
8 143 €
2015
160
10 028 €
32 327
7 921 €
2014
124
10 172 €
27 105
8 000 €

Analysis

Structure of prices per m²

Values of price percentiles per m² over the periods used for the estimated price of each type of property.

Structure of transaction amounts

Values of transaction amounts percentiles over the periods used for the estimated price of each type of property.

Transaction amounts and prices per m² by percentile

Ascending order
Percentile
Houses
house
Price per m²
Houses
house
Transaction amount
Apartments
apt.
Price per m²
Apartments
apt.
Transaction amount
10th percentile
7 507 €
497 K€
5 888 €
120 K€
20th percentile
9 274 €
770 K€
7 360 €
185 K€
30th percentile
10 229 €
997 K€
8 333 €
240 K€
40th percentile
11 486 €
1 108 K€
9 034 €
300 K€
50th percentile
12 740 €
1 335 K€
9 744 €
360 K€
60th percentile
14 758 €
1 634 K€
10 400 €
450 K€
70th percentile
17 123 €
2 007 K€
11 254 €
578 K€
80th percentile
19 458 €
2 645 K€
12 331 €
765 K€
90th percentile
24 441 €
4 962 K€
14 444 €
1 178 K€

Quarterly evolution

Evolution of the median price per m²

Evolution of the number of transactions

Quarterly data

Descending order
Quarter
Houses
house
transactions
Houses
house
Price per m²
Apartments
apt.
transactions
Apartments
apt.
Price per m²
2025 Q2
11
11 538 €
2 927
9 744 €
2025 Q1
44
14 314 €
8 128
9 578 €
2024 Q4
26
15 086 €
6 551
9 444 €
2024 Q3
41
11 667 €
6 893
9 574 €
2024 Q2
24
12 157 €
7 162
9 462 €
2024 Q1
25
12 410 €
6 096
9 517 €
2023 Q4
42
13 584 €
6 496
9 728 €
2023 Q3
44
13 472 €
7 403
10 059 €
2023 Q2
33
16 152 €
7 813
10 119 €
2023 Q1
31
14 488 €
7 662
10 288 €
2022 Q4
34
14 435 €
8 307
10 536 €
2022 Q3
43
13 851 €
9 858
10 745 €
2022 Q2
65
14 638 €
9 645
10 650 €
2022 Q1
32
17 121 €
8 298
10 678 €
2021 Q4
54
15 210 €
8 293
10 642 €
2021 Q3
55
16 000 €
9 097
10 909 €
2021 Q2
45
12 565 €
8 665
10 750 €
2021 Q1
39
16 356 €
7 270
10 722 €
2020 Q4
47
13 190 €
8 278
10 833 €
2020 Q3
35
13 178 €
6 644
10 833 €
2020 Q2
30
14 295 €
6 479
10 750 €
2020 Q1
31
12 606 €
7 400
10 515 €
2019 Q4
49
14 646 €
9 033
10 192 €
2019 Q3
47
13 152 €
9 184
10 179 €
2019 Q2
45
13 225 €
8 610
9 888 €
2019 Q1
29
12 500 €
8 186
9 722 €
2018 Q4
62
12 354 €
8 672
9 554 €
2018 Q3
43
13 378 €
8 828
9 577 €
2018 Q2
36
13 370 €
8 464
9 289 €
2018 Q1
35
11 471 €
7 864
9 076 €
2017 Q4
43
10 909 €
8 320
8 983 €
2017 Q3
47
11 018 €
9 025
8 977 €
2017 Q2
40
11 608 €
8 897
8 668 €
2017 Q1
40
12 324 €
9 054
8 435 €
2016 Q4
47
11 047 €
7 911
8 285 €
2016 Q3
52
11 260 €
9 015
8 243 €
2016 Q2
37
10 442 €
8 204
8 089 €
2016 Q1
25
10 000 €
5 782
7 874 €
2015 Q4
49
9 714 €
9 847
8 000 €
2015 Q3
47
9 631 €
8 645
7 955 €
2015 Q2
39
10 938 €
7 418
7 857 €
2015 Q1
25
10 476 €
6 417
7 867 €
2014 Q4
29
10 277 €
6 233
7 857 €
2014 Q3
39
10 138 €
7 648
8 048 €
2014 Q2
27
10 655 €
6 723
8 000 €
2014 Q1
29
9 375 €
6 501
8 000 €

Paris (75)

Most expensive cities

City
name
Descending orderHouses
house
Price per m²
30 153 €
30 050 €
23 741 €
20 316 €
17 782 €
16 256 €
15 500 €
14 756 €
14 358 €
13 963 €
City
name
Descending orderApartments
apt.
Price per m²
14 339 €
14 118 €
12 404 €
12 332 €
12 177 €
12 140 €
11 643 €
11 111 €
11 074 €
10 552 €

Least expensive cities

City
name
Ascending orderHouses
house
Price per m²
7 092 €
10 046 €
11 359 €
11 593 €
11 602 €
11 958 €
12 187 €
12 524 €
13 963 €
14 358 €
City
name
Ascending orderApartments
apt.
Price per m²
7 468 €
7 966 €
8 611 €
8 688 €
8 740 €
8 883 €
9 161 €
9 481 €
9 728 €
9 774 €