emooki
HomePrice mapTransactions
🇬🇧 English🇫🇷 Français🇩🇪 Deutsch🇪🇸 Español🇮🇹 Italiano

Real estate price map


Real estate price map in the municipality of Paris 4e Arrondissement, choose a section to see transactions by parcel.

Paris (75)

Paris 4e Arrondissement - Real estate price m²

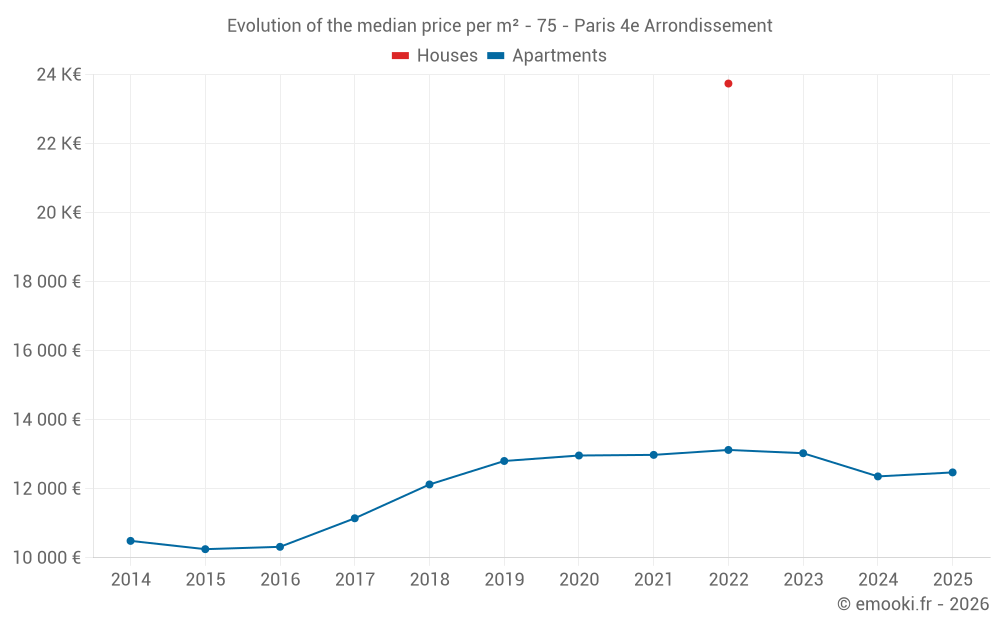
Median price of real estate
in the municipality of Paris 4e Arrondissement

HousesHouses
23 741  /m²
1-23-45-67-89-10
Reliability 1/10
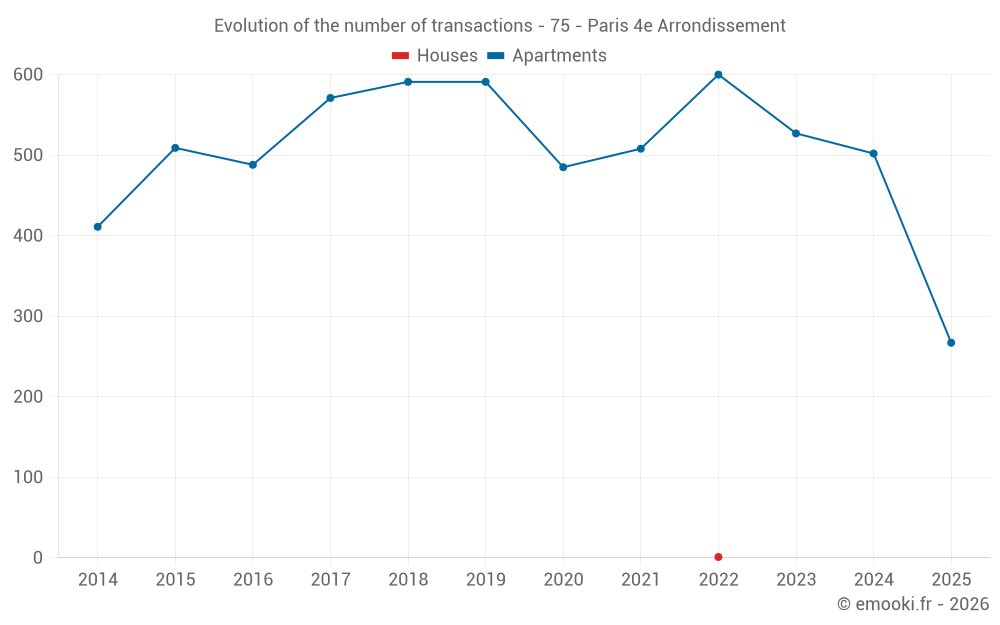
Price of the unique transaction of the last 120 months.
ApartmentsApartments
12 404  /m²
1-23-45-67-89-10
Reliability 10/10
Median price on the 92 transactions of the last 3 months.
from 10 023 to
15 639  /m²
60% of transactions from the 2nd to the 8th deciles.
DwellingsDwellings
12 404  /m²
1-23-45-67-89-10
Reliability 10/10
Median price on the 92 transactions of the last 3 months.
from 10 023 to
15 639  /m²
60% of transactions from the 2nd to the 8th deciles.
ApartmentsEvolution of the price per m² of apartments since...
1 year
+0.9%
2 years
-4.3%
3 years
-5%
4 years
-3.9%
5 years
-3.8%
6 years
-2.6%
7 years
+2.9%
8 years
+12%
9 years
+21%
10 years
+22%
11 years
+19%
The price per m² of apartments has decreased by 5% since 3 years, but it has increased by 22% in 10 years.

Yearly evolution

Evolution of the median price per m²

Evolution of the median price per m² - 75 - Paris 4e Arrondissement

Evolution of the number of transactions

Warning, last year incomplete. Projections made based on the proportions between semesters of the previous year at the departmental/national level and by type of property.

Evolution of the number of transactions - 75 - Paris 4e Arrondissement

Yearly data

Descending order
Year
Houses
house
transactions
Houses
house
Price per m²
Apartments
apt.
transactions
Apartments
apt.
Price per m²
2025
0
--- 
267
12 474 
2024
0
--- 
502
12 358 
2023
0
--- 
527
13 030 
2022
1
23 741 
600
13 125 
2021
0
--- 
508
12 982 
2020
0
--- 
485
12 964 
2019
0
--- 
591
12 805 
2018
0
--- 
591
12 125 
2017
0
--- 
571
11 145 
2016
0
--- 
488
10 318 
2015
0
--- 
509
10 250 
2014
0
--- 
411
10 490 

Analysis

Structure of prices per m²

Values of price percentiles per m² over the periods used for the estimated price of each type of property.

Structure of transaction amounts

Values of transaction amounts percentiles over the periods used for the estimated price of each type of property.

Transaction amounts and prices per m² by percentile

Ascending order
Percentile
Houses
house
Price per m²
Houses
house
Transaction amount
Apartments
apt.
Price per m²
Apartments
apt.
Transaction amount
10th percentile
23 741 
3 300 K
8 384 
149 K
20th percentile
23 741 
3 300 K
10 023 
228 K
30th percentile
23 741 
3 300 K
10 747 
300 K
40th percentile
23 741 
3 300 K
11 843 
432 K
50th percentile
23 741 
3 300 K
12 404 
524 K
60th percentile
23 741 
3 300 K
13 162 
658 K
70th percentile
23 741 
3 300 K
14 380 
813 K
80th percentile
23 741 
3 300 K
15 639 
1 146 K
90th percentile
23 741 
3 300 K
17 159 
1 395 K

National and departmental comparison

Evolution of the median price per m² of houses

Evolution of the median price per m² of apartments

Quarterly evolution

Evolution of the median price per m²

Evolution of the number of transactions

Quarterly data

Descending order
Quarter
Houses
house
transactions
Houses
house
Price per m²
Apartments
apt.
transactions
Apartments
apt.
Price per m²
2025 Q2
0
--- 
92
12 404 
2025 Q1
0
--- 
175
12 500 
2024 Q4
0
--- 
131
12 097 
2024 Q3
0
--- 
138
11 865 
2024 Q2
0
--- 
122
13 012 
2024 Q1
0
--- 
111
12 714 
2023 Q4
0
--- 
130
12 104 
2023 Q3
0
--- 
134
13 188 
2023 Q2
0
--- 
122
12 950 
2023 Q1
0
--- 
141
13 426 
2022 Q4
1
23 741 
140
12 703 
2022 Q3
0
--- 
168
13 584 
2022 Q2
0
--- 
155
12 667 
2022 Q1
0
--- 
137
13 431 
2021 Q4
0
--- 
127
13 160 
2021 Q3
0
--- 
142
13 148 
2021 Q2
0
--- 
150
12 708 
2021 Q1
0
--- 
89
12 833 
2020 Q4
0
--- 
134
12 862 
2020 Q3
0
--- 
123
13 226 
2020 Q2
0
--- 
114
12 740 
2020 Q1
0
--- 
114
13 050 
2019 Q4
0
--- 
145
12 955 
2019 Q3
0
--- 
141
13 095 
2019 Q2
0
--- 
164
12 540 
2019 Q1
0
--- 
141
12 682 
2018 Q4
0
--- 
170
12 047 
2018 Q3
0
--- 
152
12 338 
2018 Q2
0
--- 
135
12 073 
2018 Q1
0
--- 
134
11 908 
2017 Q4
0
--- 
143
11 111 
2017 Q3
0
--- 
125
11 688 
2017 Q2
0
--- 
167
11 111 
2017 Q1
0
--- 
136
10 674 
2016 Q4
0
--- 
145
10 159 
2016 Q3
0
--- 
123
10 764 
2016 Q2
0
--- 
129
10 244 
2016 Q1
0
--- 
91
10 303 
2015 Q4
0
--- 
164
10 183 
2015 Q3
0
--- 
142
10 410 
2015 Q2
0
--- 
98
10 072 
2015 Q1
0
--- 
105
10 346 
2014 Q4
0
--- 
81
10 103 
2014 Q3
0
--- 
116
11 113 
2014 Q2
0
--- 
106
10 655 
2014 Q1
0
--- 
108
10 000 

Overview of the latest real estate transactions

The following list is an anonymized overview of the latest transactions. For more details and to find all transactions, please use the map to view transactions by plot or the transaction search page for a search by criteria.

2025-06-30
3 008 700 
11 354  /m²(265 m²)
Sale
Apartments
Apartment
6 rooms
135 m2
Apartments
Apartment
6 rooms
130 m2
4 outbuildings
2025-06-30
1 300 000 
14 444  /m²(90 m²)
Sale
Apartments
Apartment
3 rooms
90 m2
1 outbuilding
2025-06-27
680 000 
19 429  /m²(35 m²)
Sale
Apartments
Apartment
2 rooms
35 m2
2025-06-27
450 000 
10 000  /m²(45 m²)
Sale
Apartments
Apartment
2 rooms
45 m2
1 outbuilding
2025-06-26
1 195 000 
18 672  /m²(64 m²)
Sale
Apartments
Apartment
2 rooms
64 m2
1 outbuilding
2025-06-26
1 150 000 
12 234  /m²(94 m²)
Sale
Apartments
Apartment
4 rooms
94 m2
1 outbuilding
2025-06-25
690 000 
15 333  /m²(45 m²)
Sale
Apartments
Apartment
2 rooms
45 m2
1 outbuilding
2025-06-25
528 000 
11 478  /m²(46 m²)
Sale
Apartments
Apartment
3 rooms
46 m2
1 outbuilding
2025-06-23
47 700 000 
Sale
2025-06-23
1 246 100 
17 070  /m²(73 m²)
Sale
Apartments
Apartment
4 rooms
73 m2
2 outbuildings
2025-06-20
35 000 
Sale
1 outbuilding
2025-06-20
526 000 
10 314  /m²(51 m²)
Sale
Apartments
Apartment
3 rooms
51 m2
1 outbuilding
2025-06-19
216 993 
7 233  /m²(30 m²)
Sale
Apartments
Apartment
1 room
30 m2
2025-06-19
215 311 
10 253  /m²(21 m²)
Sale
Apartments
Apartment
1 room
21 m2
1 outbuilding
2025-06-17
362 000 
12 067  /m²(30 m²)
Sale
Apartments
Apartment
1 room
30 m2
2025-06-17
45 000 
Sale
1 outbuilding
2025-06-17
1 000 
Sale
1 outbuilding
2025-06-17
238 200 
Sale
1 outbuilding
2025-06-17
500 000 
10 000  /m²(50 m²)
Sale
Commercial property
50 m2
2025-06-16
1 685 800 
17 745  /m²(95 m²)
Sale
Commercial property
95 m2
8205 transactions listed in the municipality

Paris (75)

Most expensive cities

City
name
Descending orderHouses
house
Price per m²
City
name
Descending orderApartments
apt.
Price per m²

Least expensive cities

City
name
Ascending orderHouses
house
Price per m²
City
name
Ascending orderApartments
apt.
Price per m²