emooki
HomePrice mapTransactions
🇬🇧 English🇫🇷 Français🇩🇪 Deutsch🇪🇸 Español🇮🇹 Italiano

Real estate price map


Real estate price map in the municipality of Saint-Martin-de-la-Porte, choose a section to see transactions by parcel.

Savoie (73)
Saint-Martin-de-la-Porte

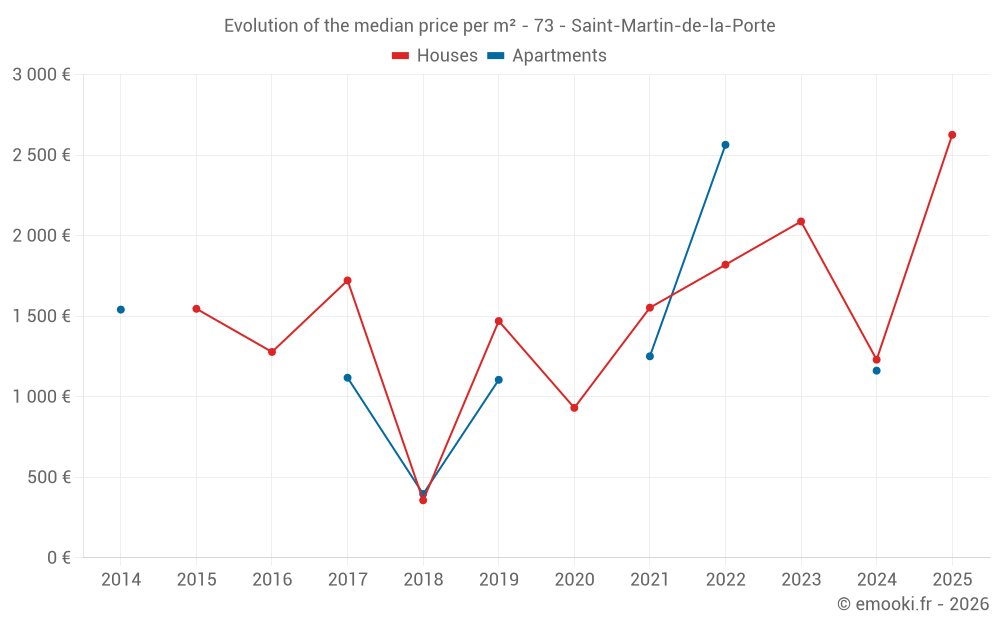
Median price of real estate
in the municipality of Saint-Martin-de-la-Porte

HousesHouses
1 403 € /m²
1-23-45-67-89-10
Reliability 7/10
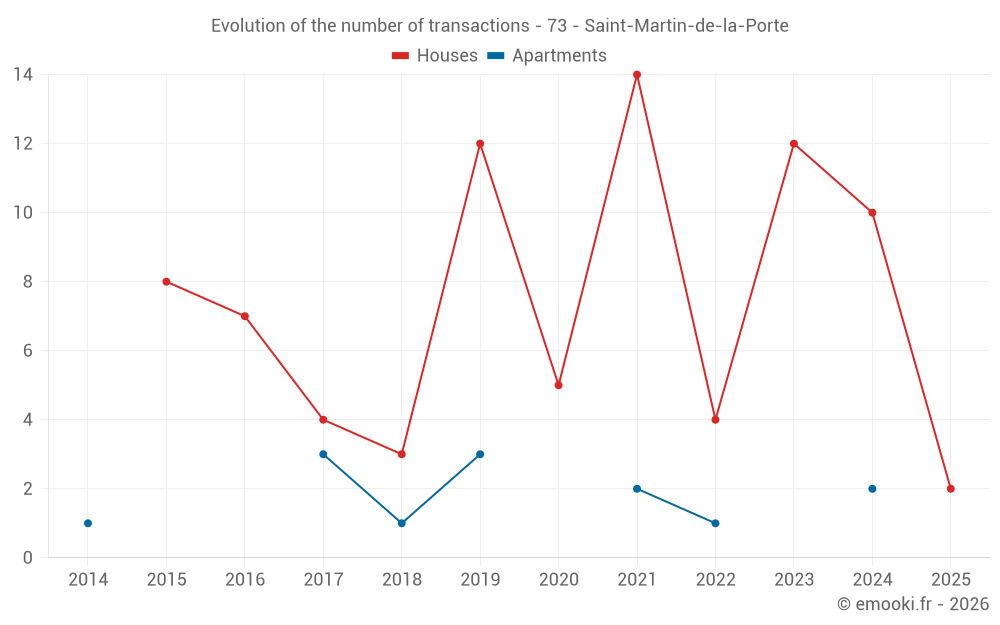
Median price on the 16 transactions of the last 24 months.
from 541 to
2 567 € /m²
60% of transactions from the 2nd to the 8th deciles.
ApartmentsApartments
1 278 € /m²
1-23-45-67-89-10
Reliability 3/10
Median price on the 7 transactions of the last 72 months.
DwellingsDwellings
1 403 € /m²
1-23-45-67-89-10
Reliability 7/10
Median price on the 18 transactions of the last 24 months.
from 474 to
2 487 € /m²
60% of transactions from the 2nd to the 8th deciles.

Yearly evolution

Evolution of the median price per m²

Evolution of the number of transactions

Warning, last year incomplete. Projections made based on the proportions between semesters of the previous year at the departmental/national level and by type of property.

Yearly data

Descending order
Year
Houses
house
transactions
Houses
house
Price per m²
Apartments
apt.
transactions
Apartments
apt.
Price per m²
2025
2
2 626 €
0
--- €
2024
10
1 230 €
2
1 162 €
2023
12
2 088 €
0
--- €
2022
4
1 820 €
1
2 564 €
2021
14
1 553 €
2
1 251 €
2020
5
931 €
0
--- €
2019
12
1 470 €
3
1 105 €
2018
3
357 €
1
396 €
2017
4
1 722 €
3
1 118 €
2016
7
1 278 €
0
--- €
2015
8
1 546 €
0
--- €
2014
0
--- €
1
1 541 €

Analysis

Structure of prices per m²

Values of price percentiles per m² over the periods used for the estimated price of each type of property.

Structure of transaction amounts

Values of transaction amounts percentiles over the periods used for the estimated price of each type of property.

Transaction amounts and prices per m² by percentile

Ascending order
Percentile
Houses
house
Price per m²
Houses
house
Transaction amount
Apartments
apt.
Price per m²
Apartments
apt.
Transaction amount
10th percentile
214 €
20 000 €
835 €
68 400 €
20th percentile
541 €
75 100 €
1 129 €
106 K€
30th percentile
782 €
85 000 €
1 200 €
114 K€
40th percentile
1 127 €
100 K€
1 246 €
132 K€
50th percentile
1 403 €
103 K€
1 278 €
156 K€
60th percentile
2 200 €
110 K€
1 427 €
158 K€
70th percentile
2 311 €
144 K€
1 600 €
163 K€
80th percentile
2 567 €
213 K€
1 821 €
176 K€
90th percentile
2 695 €
233 K€
2 163 €
189 K€

National and departmental comparison

Evolution of the median price per m² of houses

Evolution of the median price per m² of apartments

Quarterly evolution

Evolution of the median price per m²

Evolution of the number of transactions

Quarterly data

Descending order
Quarter
Houses
house
transactions
Houses
house
Price per m²
Apartments
apt.
transactions
Apartments
apt.
Price per m²
2025 Q2
1
2 367 €
0
--- €
2025 Q1
1
2 885 €
0
--- €
2024 Q4
2
580 €
1
1 895 €
2024 Q3
4
1 300 €
0
--- €
2024 Q2
2
1 766 €
1
429 €
2024 Q1
2
1 146 €
0
--- €
2023 Q4
4
1 756 €
0
--- €
2023 Q2
5
2 473 €
0
--- €
2023 Q1
3
1 882 €
0
--- €
2022 Q4
2
3 088 €
0
--- €
2022 Q3
2
1 450 €
0
--- €
2022 Q1
0
--- €
1
2 564 €
2021 Q4
3
1 895 €
0
--- €
2021 Q3
2
1 756 €
0
--- €
2021 Q2
6
1 458 €
0
--- €
2021 Q1
3
1 182 €
2
1 251 €
2020 Q4
1
931 €
0
--- €
2020 Q3
1
1 811 €
0
--- €
2020 Q2
1
850 €
0
--- €
2020 Q1
2
1 168 €
0
--- €
2019 Q4
4
1 670 €
1
1 105 €
2019 Q3
4
880 €
1
1 526 €
2019 Q2
2
1 654 €
0
--- €
2019 Q1
2
2 128 €
1
571 €
2018 Q4
1
1 542 €
0
--- €
2018 Q3
1
357 €
1
396 €
2018 Q1
1
267 €
0
--- €
2017 Q4
0
--- €
3
1 118 €
2017 Q3
1
973 €
0
--- €
2017 Q1
3
1 742 €
0
--- €
2016 Q4
1
510 €
0
--- €
2016 Q3
3
1 278 €
0
--- €
2016 Q2
1
725 €
0
--- €
2016 Q1
2
1 432 €
0
--- €
2015 Q4
2
1 276 €
0
--- €
2015 Q3
4
2 006 €
0
--- €
2015 Q2
1
1 340 €
0
--- €
2015 Q1
1
1 429 €
0
--- €
2014 Q1
0
--- €
1
1 541 €

Overview of the latest real estate transactions

The following list is an anonymized overview of the latest transactions. For more details and to find all transactions, please use the map to view transactions by plot or the transaction search page for a search by criteria.

2025-06-25
10 €
Sale
Land
17 m2
-Sols
2025-06-09
810 €
Sale
Land
27 m2
-Jardins
2025-05-19
220 €
Sale
Land
22 m2
-Jardins
2025-04-28
213 000 €
2 367 € /m²(90 m²)
Sale
Houses
House
3 rooms
90 m2
Land
414 m2
-Sols
Land
33 m2
-Sols
Land
55 m2
-Prés
2025-04-01
2 940 €
Sale
Land
98 m2
-Jardins
2025-03-04
2 705 €
Sale
Land
300 m2
-Vergers
Land
241 m2
-Vergers
2025-02-12
173 100 €
2 885 € /m²(60 m²)
Sale
Houses
House
3 rooms
60 m2
Land
48 m2
-Sols
Land
14 m2
-Vergers
2025-01-30
342 000 €
Sale
Land
158 m2
-Sols
Land
90 m2
-Jardins
Land
45 m2
-Terres
Land
450 m2
-Terres
2025-01-22
73 000 €
Sale
Land
35 m2
-Sols
2024-12-27
85 000 €
541 € /m²(157 m²)
Sale
Houses
House
5 rooms
157 m2
Land
457 m2
-Sols
Land
330 m2
-Vergers
Land
331 m2
-Vergers
Land
15 m2
-Sols
2024-12-20
85 000 €
620 € /m²(137 m²)
Sale
Houses
House
4 rooms
82 m2
Land
82 m2
-Sols
Houses
House
4 rooms
55 m2
Land
37 m2
-Sols
Land
148 m2
-Sols
2024-10-22
300 €
Sale
1 outbuilding
2024-10-14
7 000 €
Sale
Land
34 m2
-Jardins
Land
30 m2
-Sols
Land
37 m2
-Sols
2024-10-08
180 000 €
1 895 € /m²(95 m²)
Sale
Apartments
Apartment
4 rooms
95 m2
1 outbuilding
Land
244 m2
-Sols
Land
29 m2
-Prés
Land
6 m2
-Terres
Land
12 m2
-Prés
Land
5 m2
-Terres
Land
31 m2
-Terres
Land
13 m2
-Prés
Land
45 m2
-Prés
Land
1115 m2
-Sols
2024-09-20
30 000 €
261 € /m²(115 m²)
Sale
Houses
House
4 rooms
115 m2
Land
40 m2
-Sols
2024-09-20
105 000 €
2 625 € /m²(40 m²)
Sale
Houses
House
3 rooms
40 m2
Land
246 m2
-Sols
Land
93 m2
-Jardins
Land
1 m2
-Sols
2024-08-30
75 100 €
1 473 € /m²(51 m²)
Sale
Houses
House
4 rooms
51 m2
Land
69 m2
-Sols
2024-08-22
140 €
Exchange
Land
14 m2
-Prés
2024-08-22
80 €
Exchange
Land
8 m2
-Sols
2024-08-22
950 €
Sale
Land
95 m2
-Jardins

Savoie (73)

Most expensive cities

City
name
Descending orderHouses
house
Price per m²
41 730 €
15 064 €
9 926 €
8 106 €
7 708 €
7 667 €
7 570 €
6 752 €
6 185 €
6 184 €
City
name
Descending orderApartments
apt.
Price per m²
12 707 €
12 414 €
10 959 €
10 302 €
8 611 €
6 667 €
6 146 €
6 116 €
5 907 €
5 770 €

Least expensive cities

City
name
Ascending orderHouses
house
Price per m²
1 219 €
1 250 €
1 316 €
1 333 €
1 344 €
1 354 €
1 384 €
1 403 €
1 456 €
1 500 €
City
name
Ascending orderApartments
apt.
Price per m²
188 €
296 €
368 €
400 €
520 €
528 €
532 €
596 €
672 €
797 €