emooki
HomePrice mapTransactions
🇬🇧 English🇫🇷 Français🇩🇪 Deutsch🇪🇸 Español🇮🇹 Italiano

Real estate price map


Real estate price map in the municipality of Le Brugeron, choose a section to see transactions by parcel.

Puy-de-Dôme (63)

Le Brugeron - Real estate price m²

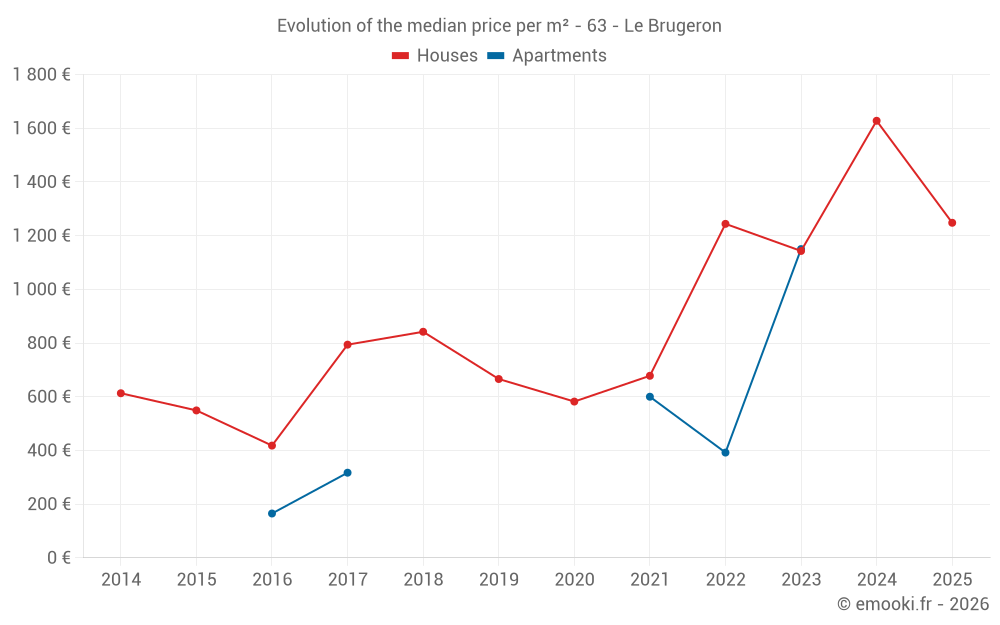
Median price of real estate
in the municipality of Le Brugeron

HousesHouses
1 244  /m²
1-23-45-67-89-10
Reliability 6/10
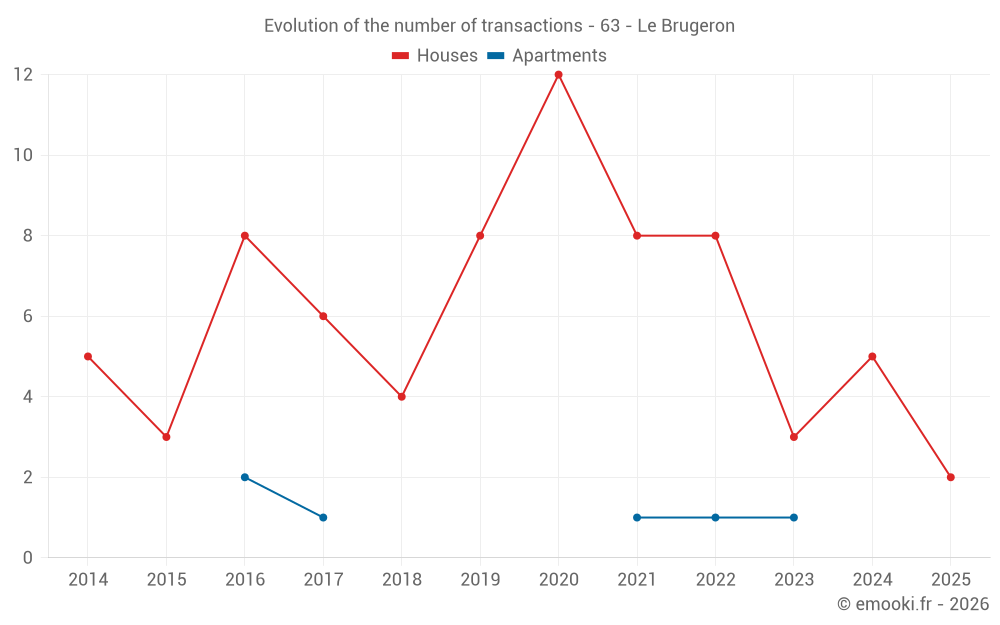
Median price on the 16 transactions of the last 36 months.
from 894 to
1 755  /m²
60% of transactions from the 2nd to the 8th deciles.
ApartmentsApartments
354  /m²
1-23-45-67-89-10
Reliability 1/10
Median price on the 6 transactions of the last 120 months.
DwellingsDwellings
1 184  /m²
1-23-45-67-89-10
Reliability 6/10
Median price on the 17 transactions of the last 36 months.
from 933 to
1 730  /m²
60% of transactions from the 2nd to the 8th deciles.

Yearly evolution

Evolution of the median price per m²

Evolution of the median price per m² - 63 - Le Brugeron

Evolution of the number of transactions

Warning, last year incomplete. Projections made based on the proportions between semesters of the previous year at the departmental/national level and by type of property.

Evolution of the number of transactions - 63 - Le Brugeron

Yearly data

Descending order
Year
Houses
house
transactions
Houses
house
Price per m²
Apartments
apt.
transactions
Apartments
apt.
Price per m²
2025
2
1 248 
0
--- 
2024
5
1 628 
0
--- 
2023
3
1 143 
1
1 150 
2022
8
1 244 
1
392 
2021
8
678 
1
600 
2020
12
582 
0
--- 
2019
8
666 
0
--- 
2018
4
842 
0
--- 
2017
6
794 
1
317 
2016
8
418 
2
165 
2015
3
549 
0
--- 
2014
5
613 
0
--- 

Analysis

Structure of prices per m²

Values of price percentiles per m² over the periods used for the estimated price of each type of property.

Structure of transaction amounts

Values of transaction amounts percentiles over the periods used for the estimated price of each type of property.

Transaction amounts and prices per m² by percentile

Ascending order
Percentile
Houses
house
Price per m²
Houses
house
Transaction amount
Apartments
apt.
Price per m²
Apartments
apt.
Transaction amount
10th percentile
516 
30 000 
165 
12 750 
20th percentile
894 
60 000 
180 
13 500 
30th percentile
1 116 
75 500 
248 
13 500 
40th percentile
1 167 
80 000 
317 
13 500 
50th percentile
1 244 
94 626 
354 
16 750 
60th percentile
1 444 
108 K
392 
20 000 
70th percentile
1 615 
122 K
496 
21 500 
80th percentile
1 755 
191 K
600 
23 000 
90th percentile
2 252 
231 K
875 
26 000 

National and departmental comparison

Evolution of the median price per m² of houses

Evolution of the median price per m² of apartments

Quarterly evolution

Evolution of the median price per m²

Evolution of the number of transactions

Quarterly data

Descending order
Quarter
Houses
house
transactions
Houses
house
Price per m²
Apartments
apt.
transactions
Apartments
apt.
Price per m²
2025 Q2
1
1 602 
0
--- 
2025 Q1
1
894 
0
--- 
2024 Q4
1
2 117 
0
--- 
2024 Q3
2
1 738 
0
--- 
2024 Q2
1
1 628 
0
--- 
2024 Q1
1
1 167 
0
--- 
2023 Q4
1
1 143 
0
--- 
2023 Q2
1
1 444 
0
--- 
2023 Q1
1
173 
1
1 150 
2022 Q4
3
1 755 
0
--- 
2022 Q3
3
1 184 
0
--- 
2022 Q2
0
--- 
1
392 
2022 Q1
2
1 014 
0
--- 
2021 Q4
3
920 
0
--- 
2021 Q3
2
340 
1
600 
2021 Q2
2
804 
0
--- 
2021 Q1
1
567 
0
--- 
2020 Q4
3
950 
0
--- 
2020 Q3
3
396 
0
--- 
2020 Q2
4
1 174 
0
--- 
2020 Q1
2
214 
0
--- 
2019 Q4
2
530 
0
--- 
2019 Q3
2
862 
0
--- 
2019 Q2
2
2 102 
0
--- 
2019 Q1
2
286 
0
--- 
2018 Q4
2
887 
0
--- 
2018 Q3
1
400 
0
--- 
2018 Q1
1
909 
0
--- 
2017 Q4
1
449 
0
--- 
2017 Q2
2
1 278 
0
--- 
2017 Q1
3
850 
1
317 
2016 Q4
0
--- 
2
165 
2016 Q3
2
656 
0
--- 
2016 Q2
3
375 
0
--- 
2016 Q1
3
417 
0
--- 
2015 Q4
1
867 
0
--- 
2015 Q2
2
374 
0
--- 
2014 Q4
1
613 
0
--- 
2014 Q3
1
1 442 
0
--- 
2014 Q1
3
400 
0
--- 

Overview of the latest real estate transactions

The following list is an anonymized overview of the latest transactions. For more details and to find all transactions, please use the map to view transactions by plot or the transaction search page for a search by criteria.

2025-06-30
300 
Sale
Land
710 m2
-Pâtures
2025-05-20
346 000 
1 602  /m²(216 m²)
Sale
Houses
House
4 rooms
121 m2
Houses
House
4 rooms
95 m2
Land
1030 m2
-Sols
Land
19 m2
-Terres
Land
3750 m2
-Prés
2025-05-07
2 000 
Sale
Land
3520 m2
-Futaies résineuses
Land
1464 m2
-Futaies résineuses
Land
1150 m2
-Prés
Land
4023 m2
-Pâtures
Land
727 m2
-Pâtures
Land
4420 m2
-Futaies feuillues
Land
2257 m2
-Futaies feuillues
Land
6474 m2
-Futaies résineuses
Land
1920 m2
-Pâtures
2025-04-08
10 000 
Sale
Land
77 m2
-Sols
Land
2749 m2
-Prés
Land
3710 m2
-Futaies feuillues
2025-03-29
76 000 
894  /m²(85 m²)
Sale
Houses
House
2 rooms
85 m2
Land
292 m2
-Sols
Land
82 m2
-Sols
2025-03-28
7 000 
Sale
Land
9932 m2
-Futaies résineuses
Land
8125 m2
-Taillis simples
2025-02-28
1 335 
Sale
Land
13230 m2
-Terres
2025-02-14
2 000 
Sale
Land
3668 m2
-Terres
Land
3760 m2
-Taillis simples
2025-01-27
1 700 
Sale
Land
574 m2
-Taillis simples
Land
703 m2
-Futaies résineuses
Land
246 m2
-Bois
Land
300 m2
-Bois
2025-01-08
5 000 
Sale
Land
2173 m2
-Futaies résineuses
Land
8250 m2
-Terres
Land
5025 m2
-Futaies feuillues
2024-12-27
7 000 
Sale
Land
1050 m2
-Prés
Land
20 m2
-Sols
Land
1095 m2
-Sols
2024-11-06
190 500 
2 117  /m²(90 m²)
Sale
Houses
House
4 rooms
90 m2
Land
1623 m2
-Terrains d'agrément
Land
500 m2
-Sols
2024-10-08
950 
Sale
Land
4200 m2
-Taillis simples
2024-10-03
1 200 
Sale
Land
645 m2
-Prés
Land
1311 m2
-Prés
Land
1810 m2
-Prés
Land
1105 m2
-Prés
Land
1430 m2
-Prés
2024-10-02
1 550 
Sale
Land
6440 m2
-Futaies résineuses
Land
377 m2
-Taillis simples
Land
7184 m2
-Futaies mixtes
2024-09-25
191 058 
2 388  /m²(80 m²)
Sale
Houses
House
12 rooms
80 m2
Land
970 m2
-Sols
Land
100 m2
-Futaies feuillues
Land
927 m2
-Taillis simples
Land
21860 m2
-Futaies feuillues
Land
21170 m2
-Prés
Land
1963 m2
-Terres
Land
4690 m2
-Taillis simples
2024-09-20
7 000 
Sale
Land
1860 m2
-Futaies résineuses
Land
2850 m2
-Futaies résineuses
Land
4870 m2
-Futaies résineuses
Land
2993 m2
-Pâtures
Land
1871 m2
-Futaies feuillues
Land
2810 m2
-Futaies résineuses
Land
9500 m2
-Futaies feuillues
Land
360 m2
-Pâtures
2024-09-11
500 
Sale
Land
3749 m2
-Landes
2024-07-26
19 000 
Sale
Land
7968 m2
-Futaies résineuses
Land
2660 m2
-Taillis simples
Land
15750 m2
-Futaies résineuses
Land
11465 m2
-Futaies résineuses
Land
9075 m2
-Taillis simples
2024-07-16
1 000 
Sale
Land
6670 m2
-Terres
Land
3000 m2
-Futaies résineuses
294 transactions listed in the municipality

Puy-de-Dôme (63)

Most expensive cities

City
name
Descending orderHouses
house
Price per m²
3 348 
2 813 
2 755 
2 708 
2 658 
2 616 
2 602 
2 558 
City
name
Descending orderApartments
apt.
Price per m²
4 718 
2 935 
2 600 
2 591 
2 495 
2 472 
2 468 
2 388 

Least expensive cities

City
name
Ascending orderHouses
house
Price per m²
378 
412 
486 
492 
500 
506 
City
name
Ascending orderApartments
apt.
Price per m²
24 
113 
115 
123 
124