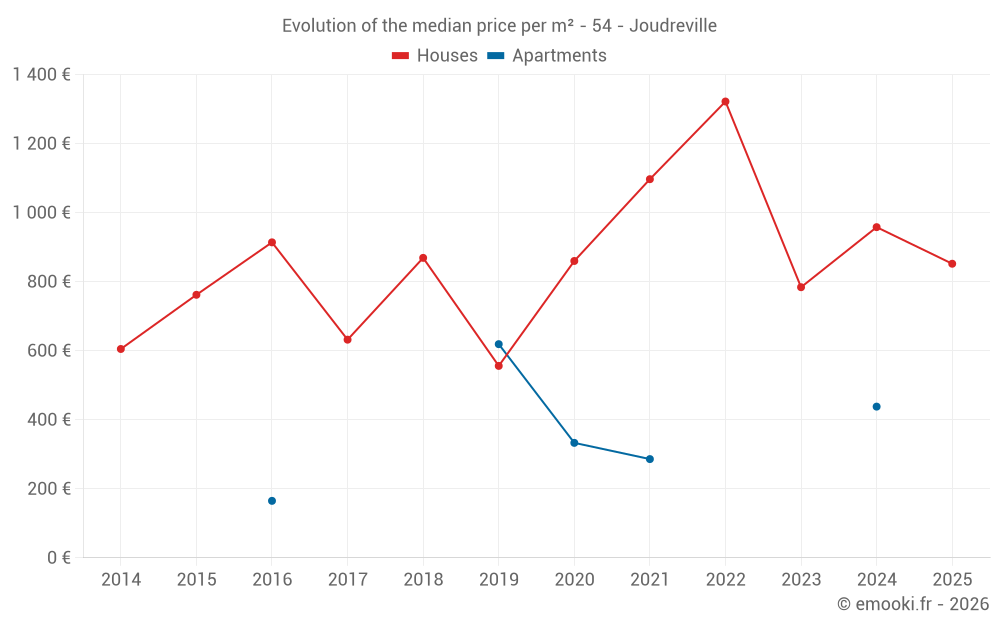
Median price of real estate
in the municipality of Joudreville
Houses
852 € /m²
Reliability 8/10
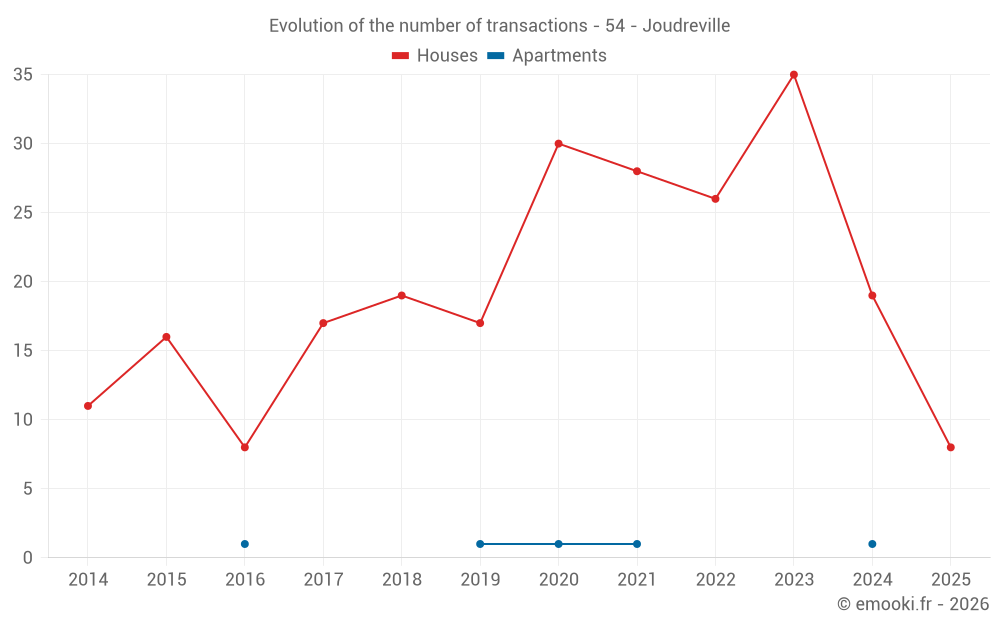
Median price on the 18 transactions of the last 12 months.
from 517 to
1 169 € /m²
1 169 € /m²
60% of transactions from the 2nd to the 8th deciles.
Apartments
386 € /m²
Reliability 2/10
Median price on the 4 transactions of the last 96 months.
Dwellings
852 € /m²
Reliability 8/10
Median price on the 18 transactions of the last 12 months.
from 517 to
1 169 € /m²
1 169 € /m²
60% of transactions from the 2nd to the 8th deciles.