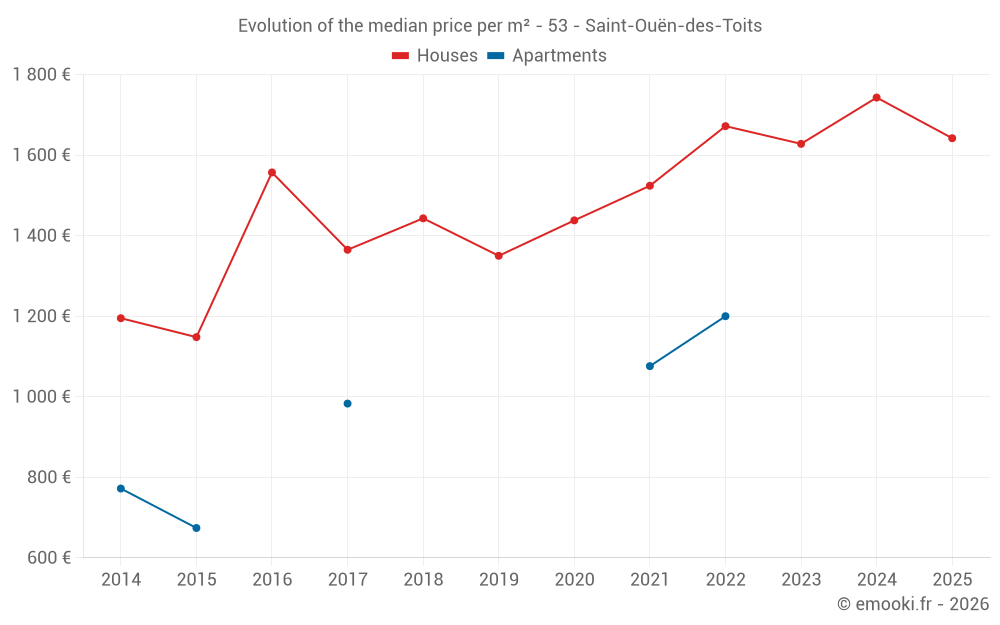
Median price of real estate
in the municipality of Saint-Ouën-des-Toits
Houses
1 660 € /m²
Reliability 7/10
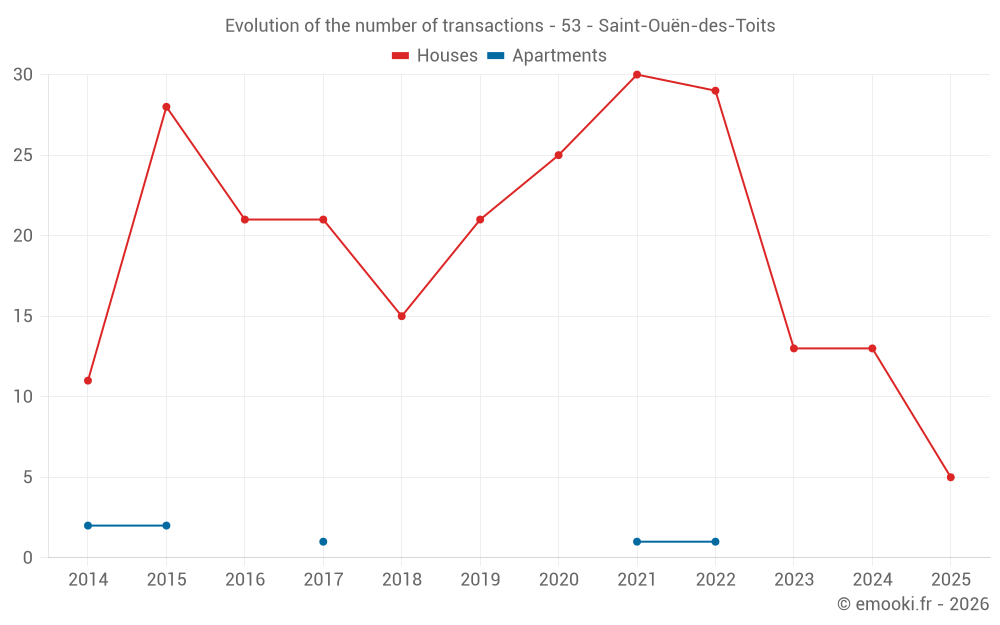
Median price on the 24 transactions of the last 24 months.
from 1 138 to
1 939 € /m²
1 939 € /m²
60% of transactions from the 2nd to the 8th deciles.
Apartments
1 076 € /m²
Reliability 1/10
Median price on the 3 transactions of the last 120 months.
Dwellings
1 660 € /m²
Reliability 7/10
Median price on the 24 transactions of the last 24 months.
from 1 138 to
1 939 € /m²
1 939 € /m²
60% of transactions from the 2nd to the 8th deciles.